

Question: A B C D E F Hispanic (any White (includes Hispanic) Asian / Pacific American Indian/ Islander 1 Alaska Native (includes Hispanic) Hispanic) (includes
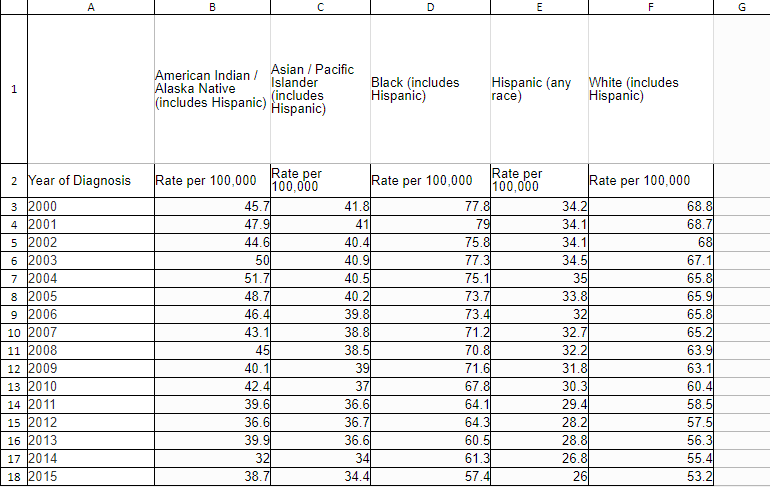
A B C D E F Hispanic (any White (includes Hispanic) Asian / Pacific American Indian/ Islander 1 Alaska Native (includes Hispanic) Hispanic) (includes Black (includes Hispanic) race) 2 Year of Diagnosis Rate per 100,000 Rate per 100,000 Rate per 100,000 Rate per 100,000 Rate per 100,000 3 2000 45.7 41.8 77.8 34.2 68.8 4 2001 47.9 41 79 34.1 68.7 5 2002 44.6 40.4 75.8 34.1 68 6 2003 50 40.9 77.3 34.5 67.1 7 2004 51.7 40.5 75.1 35 65.8 8 2005 48.7 40.2 73.7 33.8 65.9 9 2006 46.4 39.8 73.4 32 65.8 10 2007 43.1 38.8 71.2 32.7 65.2 11 2008 45 38.5 70.8 32.2 63.9 12 2009 40.1 39 71.6 31.8 63.1 13 2010 42.4 37 67.8 30.3 60.4 14 2011 39.6 36.6 64.1 29.4 58.5 15 2012 36.6 36.7 64.3 28.2 57.5 16 2013 39.9 36.6 60.5 28.8 56.3 17 2014 32 34 61.3 26.8 55.4 18 2015 38.7 34.4 57.4 26 53.2
Step by Step Solution
There are 3 Steps involved in it

Get step-by-step solutions from verified subject matter experts