

Question: A B C D E Region Date Sales Variable Cost Fixed Costs East 1/1/19 $ 925,747 $ 546,398 $ 21,378 East 2/1/19 $ 1,729,062 1,296,358
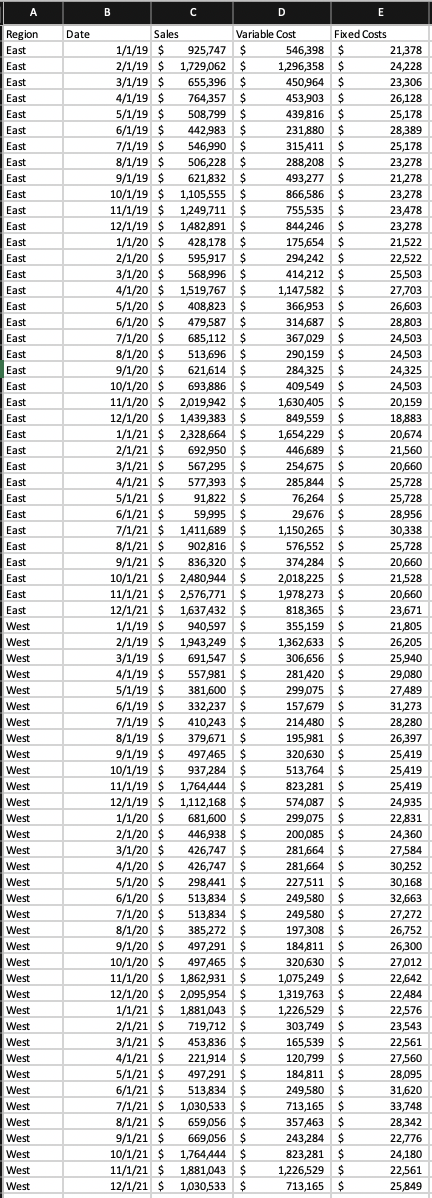
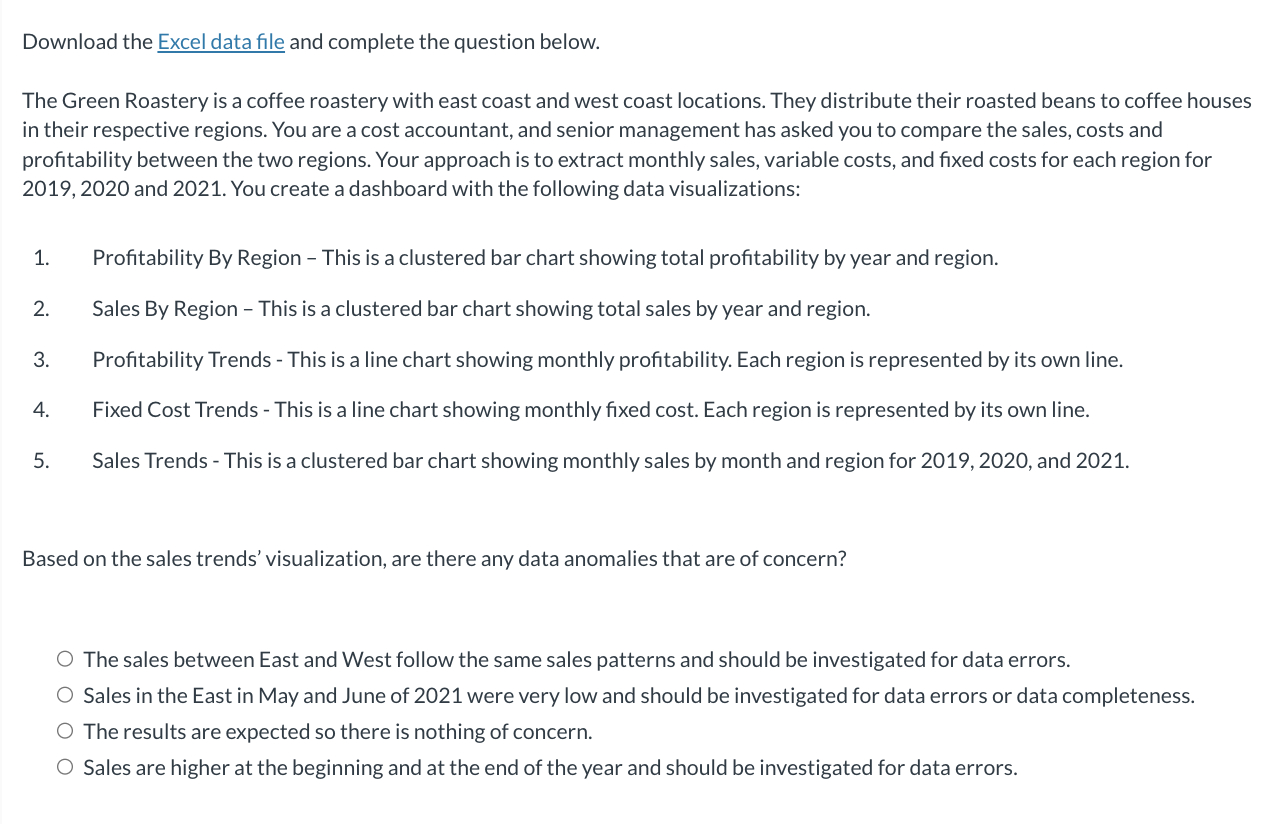
A B C D E Region Date Sales Variable Cost Fixed Costs East 1/1/19 $ 925,747 $ 546,398 $ 21,378 East 2/1/19 $ 1,729,062 1,296,358 24,228 East 3/1/19 $ 655,396 $ 450,964 23,306 East 4/1/19 $ 764,357 453,903 26,128 East 5/1/19 $ 508,799 $ 439,816 25,178 East 6/1/19 $ 442,983 $ 231,880 28,389 East 7/1/19 546,990 315,411 25,178 East 8/1/19 $ 506,228 288,208 23,278 East 9/1/19 $ 621,832 493,277 21,278 East 10/1/19 $ 1,105,555 866,586 23,278 East 11/1/19 $ 1,249,711 755,535 23,478 East 12/1/19 $ 1,482,891 $ 844,246 23,278 East 1/1/20 $ 428,178 175,654 21,522 East 2/1/20 $ 595,917 294,242 22,522 East 3/1/20 $ 568,996 414,212 25,503 East 4/1/20 $ 1,519,767 1,147,582 27,703 East 5/1/20 $ 408,823 366,953 26,603 East 6/1/20 $ 479,587 314,687 28,803 East 7/1/20 $ 685,112 367,029 24,503 East 8/1/20 $ 513,696 $ 290,159 24,503 East 9/1/20 $ 621,614 $ 284,325 24,325 East 10/1/20 $ 693,886 409,549 24,503 East 11/1/20 $ 2,019,942 $ 1,630,405 20,159 East 12/1/20 $ 1,439,383 849,559 18,883 East 1/1/21 $ 2,328,664 1,654,229 20,674 East 2/1/21 $ 692,950 446,689 21,560 East 3/1/21 $ 567,295 $ 254,675 20,660 East 4/1/21 $ 577,393 $ 285,844 25,728 East 5/1/21 $ 91,822 76,264 25,728 East 6/1/21 $ 59.995 29,676 28,956 East 7/1/21 $ 1,411,689 1,150,265 30,338 East 8/1/21 $ 902,816 576,552 25,728 East 9/1/21 $ 836,320 374,284 20,660 East 10/1/21 $ 2,480,944 2,018,225 21,528 East 11/1/21 $ 2,576,771 $ 1,978,273 20,660 East 12/1/21 $ 1,637 432 818,365 23,671 West 1/1/19 $ 940,597 $ 355,159 21,805 West 2/1/19 $ 1,943,249 1,362,633 26,205 West 3/1/19 $ 691,547 306,656 25,940 West 4/1/19 $ 557,981 281,420 29,080 West 5/1/19 $ 381,600 299,075 27489 West 6/1/19 $ 332,237 $ 157,679 31,273 West 7/1/19 $ 410,243 214,480 28,280 West 8/1/19 $ 379,671 $ 195,981 26,397 West 9/1/19 $ 497 465 $ 320,630 25,419 West 10/1/19 $ 937,284 513,764 25,419 West 11/1/19 $ 1,764,444 $ 823,281 25,419 West 12/1/19 $ 1,112,168 574,087 24,935 West 1/1/20 $ 681,600 $ 299,075 22,831 West 2/1/20 $ 446,938 200,085 24,360 West 3/1/20 $ 426,747 $ 281,664 27,584 West 4/1/20 $ 426,747 281,664 30,252 West 5/1/20 $ 298,441 227,511 30,168 West 6/1/20 $ 513,834 249,580 32,663 West 7/1/20 $ 513,834 249,580 27,272 West 8/1/20 $ 385,272 197,308 26,752 West 9/1/20 $ 497,291 184,811 26,300 West 10/1/20 $ 497 465 $ 320,630 27,012 West 11/1/20 $ 1,862,931 $ 1,075,249 22,642 West 12/1/20 $ 2,095,954 $ 1,319,763 22,484 West 1/1/21 $ 1,881,043 1,226,529 22,576 West 2/1/21 $ 719,712 303,749 23,543 West 3/1/21 $ 453,836 165,539 22,561 West 4/1/21 $ 221,914 120,799 27,560 West 5/1/21 $ 497,291 184,811 28,095 West 6/1/21 $ 513,834 249,580 31,620 West 7/1/21 $ 1,030,533 713,165 33,748 West 8/1/21 $ 659,056 357 463 28,342 West 9/1/21 $ 669,056 243,284 22,776 West 10/1/21 $ 1,764,444 823,281 24,180 West 11/1/21 $ 1,881,043 1,226,529 22,561 West 12/1/21 $ 1,030,533 $ 713,165 $ 25,849Download the Excel data le and complete the question below. The Green Roastery is a coffee roastery with east coast and west coast locations. They distribute their roasted beans to coffee houses in their respective regions. You are a cost accountant, and senior management has asked you to compare the sales, costs and protability between the two regions. Your approach is to extract monthly sales, variable costs, and xed costs for each region for 2019, 2020 and 2021. You create a dashboard with the following data visualizations: 1. Protability By Region This is a clustered bar chart showing total protability by year and region. 2. Sales By Region 7 This is a clustered bar chart showing total sales by year and region. 3. Protability Trends - This is a line chart showing monthly protability. Each region is represented by its own line. 4. Fixed Cost Trends - This is a line chart showing monthly xed cost. Each region is represented by its own line. 5. Sales Trends - This is a clustered bar chart showing monthly sales by month and region for 2019, 2020, and 2021. Based on the sales trends' visualization, are there any data anomalies that are of concern? 0 The sales between East and West follow the same sales patterns and should be investigated for data errors. 0 Sales in the East in May and June of 2021 were very low and should be investigated for data errors or data completeness. O The results are expected so there is nothing of concern. 0 Sales are higher at the beginning and at the end of the year and should be investigated for data errors
Step by Step Solution
There are 3 Steps involved in it

Get step-by-step solutions from verified subject matter experts