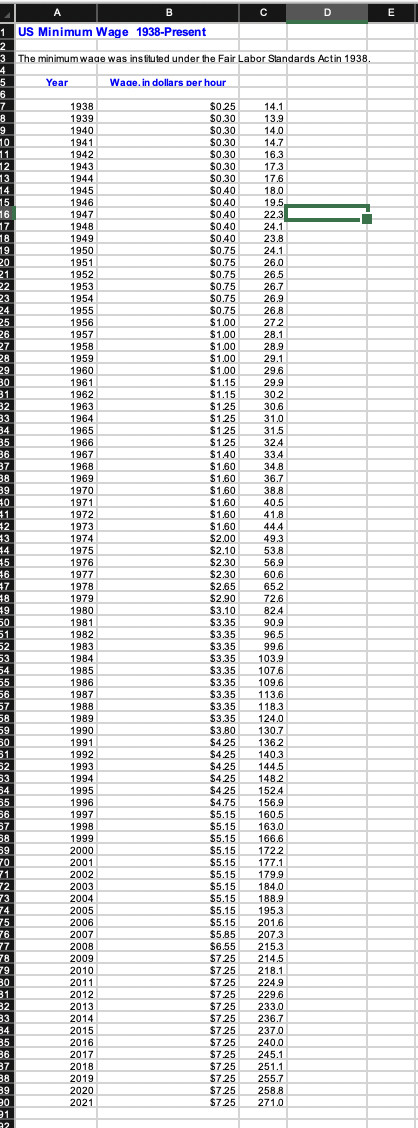
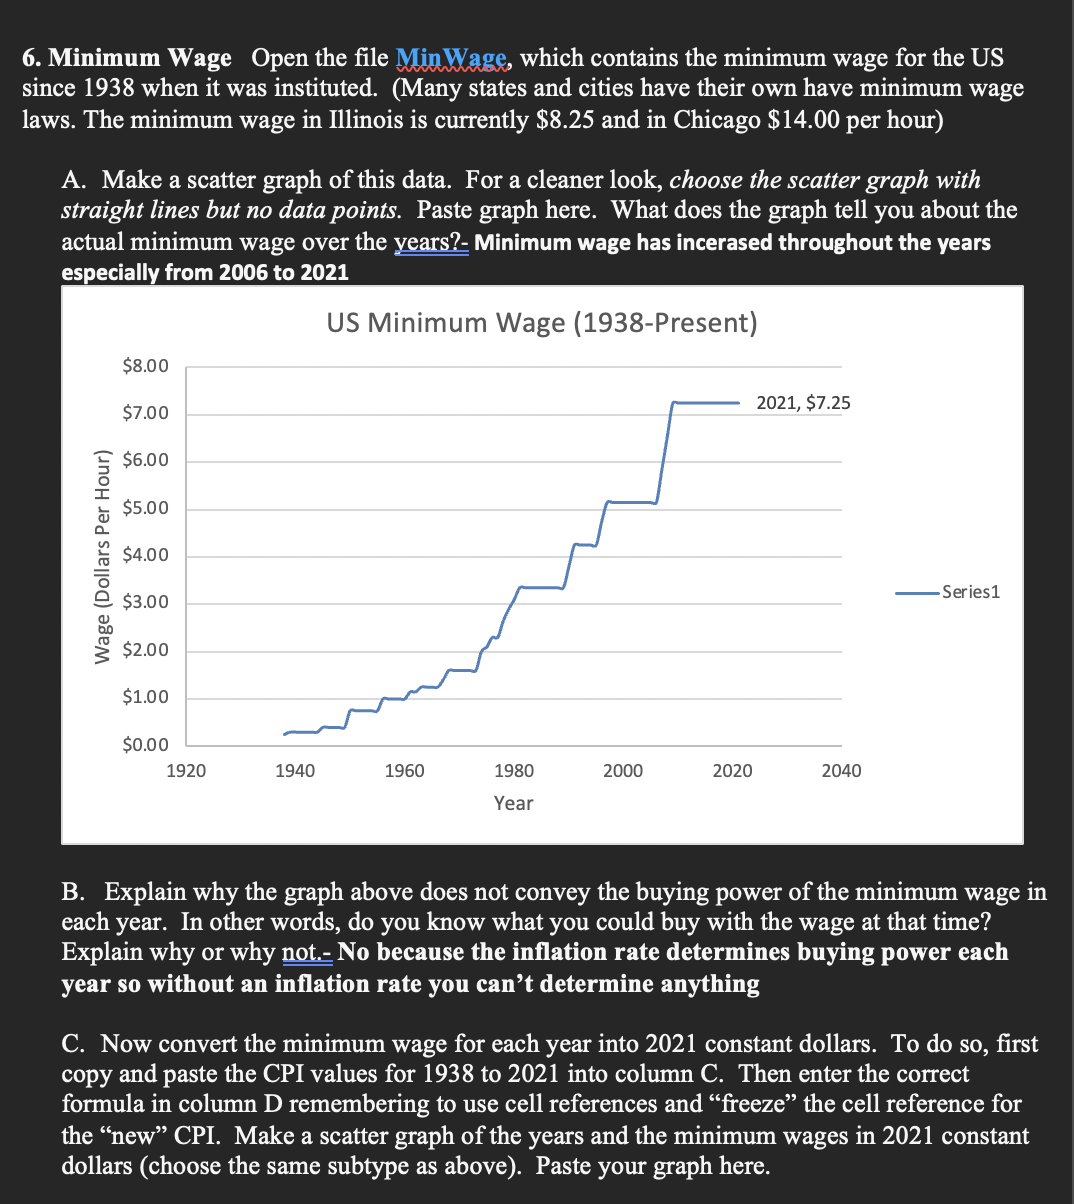
Question: A B C D E US Minimum Wage 1938-Present The minimum wage was instituted under the Fair Labor Standards Actin 1938. Year Wage. in dollars

A B C D E US Minimum Wage 1938-Present TheA B C D E US Minimum Wage 1938-Present The
A B C D E US Minimum Wage 1938-Present The minimum wage was instituted under the Fair Labor Standards Actin 1938. Year Wage. in dollars per hour 1938 $0.25 14.1 1939 $0.30 13.9 1940 $0.30 14.0 1941 $0.30 14.7 1942 $0.30 16.3 1943 $0.30 17.3 1944 $0.30 17.6 1945 $0.40 18.0 1946 $0.40 19.5 1947 $0.40 22.3 1948 $0.40 24.1 1949 $0.40 23.B 1950 $0.75 24.1 1951 $0.75 26.0 1952 $0.75 26.5 1953 $0.75 26.7 1954 $0.75 26.9 1955 $0.75 26.8 1956 $1.00 27 2 1957 $1.00 28.1 1958 $1.00 28.9 1959 $1.00 29.1 1960 $1.00 29.6 1961 $1.15 29.9 1962 $1.15 30.2 1963 $1.25 30.6 1964 $1.25 31.0 1965 $1.25 31.5 1966 $1.25 32.4 1967 $1.40 33.4 1968 $1.60 34.8 1969 $1.60 36.7 1970 $1.60 38.B 1971 $1.60 40.5 1972 $1.60 41.8 1973 $1.60 44.4 1974 $2.00 49.3 1975 $2.10 53.B 1976 $2.30 56.9 1977 $2.30 60.6 1978 $2.65 65.2 1979 $2.90 72.5 1980 $3.10 32.4 1981 $3.35 90.9 1982 $3.35 96.5 1983 $3.35 99.6 1984 $3.35 103.9 1985 $3.35 107.6 1986 $3.35 109.6 1987 $3.35 113.6 1988 $3.35 118.3 1989 $3.35 124.0 1990 $3.80 130.7 1991 $4.25 136.2 1992 $4.25 140.3 1993 $4.25 144.5 1994 $4.25 148.2 1995 $4.25 152.4 1996 $4.75 156.9 1997 $5.15 160.5 1998 $5.15 163.0 1999 $5.15 166.6 2000 $5.15 172.2 2001 $5.15 177.1 2002 $5.15 179.9 2003 $5.15 184.0 2004 $5.15 188.9 2005 $5.15 195.3 2006 $5.15 201.6 2007 $5.85 207 .3 2008 $6.55 215.3 2009 $7 25 214.5 2010 $7 25 218.1 2011 $7.25 224.9 2012 $7 25 229.6 2013 $7 25 233.0 2014 $7 25 236.7 2015 $7 25 237.0 2016 $7 .25 240.0 2017 $7 25 245.1 2018 $7.25 251.1 2019 $7 25 255.7 2020 $7 25 258.8 2021 $7.25 271.06. Minimum Wage Open the file Min Wage, which contains the minimum wage for the US since 1938 when it was instituted. (Many states and cities have their own have minimum wage laws. The minimum wage in Illinois is currently $8.25 and in Chicago $14.00 per hour) A. Make a scatter graph of this data. For a cleaner look, choose the scatter graph with straight lines but no data points. Paste graph here. What does the graph tell you about the actual minimum wage over the years?- Minimum wage has incerased throughout the years especially from 2006 to 2021 US Minimum Wage (1938-Present) $8.00 $7.00 2021, $7.25 $6.00 $5.00 Wage (Dollars Per Hour) $4.00 $3.00 Series 1 $2.00 $1.00 $0.00 1920 1940 1960 1980 2000 2020 2040 Year B. Explain why the graph above does not convey the buying power of the minimum wage in each year. In other words, do you know what you could buy with the wage at that time? Explain why or why not.- No because the inflation rate determines buying power each year so without an inflation rate you can't determine anything C. Now convert the minimum wage for each year into 2021 constant dollars. To do so, first copy and paste the CPI values for 1938 to 2021 into column C. Then enter the correct formula in column D remembering to use cell references and "freeze" the cell reference for the "new" CPI. Make a scatter graph of the years and the minimum wages in 2021 constant dollars (choose the same subtype as above). Paste your graph here

Step by Step Solution

There are 3 Steps involved in it

1 Expert Approved Answer
Step: 1 Unlock blur-text-image
Question Has Been Solved by an Expert!

Get step-by-step solutions from verified subject matter experts

Step: 2 Unlock
Step: 3 Unlock

Students Have Also Explored These Related Mathematics Questions!