

Question: A B C D H . L M N D P R S T 1 Stock A 8.00% 1.71% 13.08% Stock B 11.00% 2.67% 16.34%
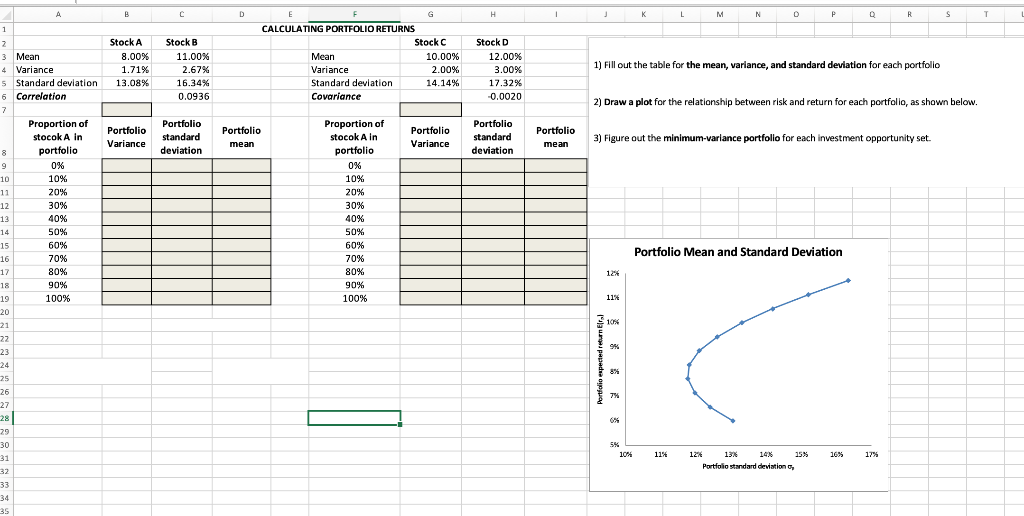
A B C D H . L M N D P R S T 1 Stock A 8.00% 1.71% 13.08% Stock B 11.00% 2.67% 16.34% 0.0936 CALCULATING PORTFOLIO RETURNS Stock C Mean 10.00% Variance 2.00% Standard deviation 14.14% Covariance Stock D 12.00% 3.00% 17.32% -0.0020 1) Fill out the table for the mean, variance, and standard deviation for each portfolio 2) Draw a plot for the relationship between risk and return for each portfolio, as shown below. Portfolio Portfolio Variance Portfolio standard deviation Portfolio Variance Portfolio standard deviation Portfolio mean 3) Figure out the minimum-variance portfolio for each investment opportunity set mean 2 3 Mean 4 Variance 5 Standard deviation 6 Correlation 7 Proportion of stocok A In 8 portfolio 9 0% 10 10% 11 20% 12 30% 13 40% 14 50% 15 60% 16 70% 17 80% 18 90% 19 100% 20 21 22 23 Proportion of stocok A In portfolio 0% 10% 20% 30% 40% 50% 60% 70% 80% 90% 100% Portfolio Mean and Standard Deviation 12% 11% 10 Portfolio expected returneral TH 281 25 26 27 28 29 30 31 32 33 34 35 5% 10% 114 16% 17% 1297 13% 14% 15% Portfolio standard deviation
Step by Step Solution
There are 3 Steps involved in it

Get step-by-step solutions from verified subject matter experts