

Question: A B C Year S&P Total return. Risk free rate 2 1990 -3.10% 7.89% -11.20% 3 1991 30.47% 5.86% 32.57% 4 1992 7.62% 3.89% 25.56%
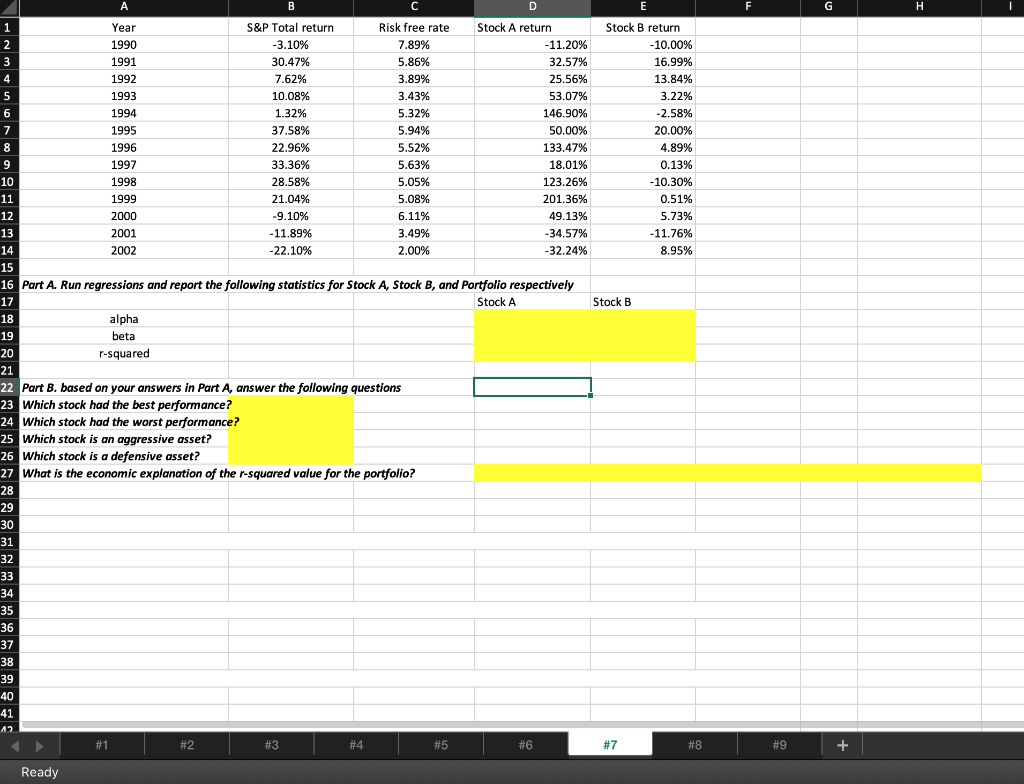
A B C Year S&P Total return. Risk free rate 2 1990 -3.10% 7.89% -11.20% 3 1991 30.47% 5.86% 32.57% 4 1992 7.62% 3.89% 25.56% 5 1993 10.08% 3.43% 53.07% 6 1994 1.32% 5.32% 146.90% 7 1995 37.58% 5.94% 50.00% 8 1996 22.96% 5.52% 133.47% 9 1997 33.36% 5.63% 18.01% 10 1998 28.58% 5.05% 123.26% 11 1999 21.04% 5.08% 201.36% 12 2000 -9.10% 6.11% 49.13% 13 2001 -11.89% 3.49% -34.57% 14 2002 -22.10% 2.00% -32.24% 15 16 Part A. Run regressions and report the following statistics for Stock A, Stock B, and Portfolio respectively 17 Stock A Stock B 18 19 alpha beta r-squared 20 21 22 Part B. based on your answers in Part A, answer the following questions 23 Which stock had the best performance? 24 Which stock had the worst performance? 25 Which stock is an aggressive asset? 26 Which stock is a defensive asset? 27 What is the economic explanation of the r-squared value for the portfolio? 28 29 30 31 32 33 34 35 36 37 38 39 40 41 12 #2 #3 #4 #5 1 Ready D Stock A return #1 E Stock B return #6 #7 -10.00% 16.99% 13.84% 3.22% -2.58% 20.00% 4.89% 0.13% -10.30% 0.51% 5.73% -11.76% 8.95% #8 F #9 G + H A B C Year S&P Total return. Risk free rate 2 1990 -3.10% 7.89% -11.20% 3 1991 30.47% 5.86% 32.57% 4 1992 7.62% 3.89% 25.56% 5 1993 10.08% 3.43% 53.07% 6 1994 1.32% 5.32% 146.90% 7 1995 37.58% 5.94% 50.00% 8 1996 22.96% 5.52% 133.47% 9 1997 33.36% 5.63% 18.01% 10 1998 28.58% 5.05% 123.26% 11 1999 21.04% 5.08% 201.36% 12 2000 -9.10% 6.11% 49.13% 13 2001 -11.89% 3.49% -34.57% 14 2002 -22.10% 2.00% -32.24% 15 16 Part A. Run regressions and report the following statistics for Stock A, Stock B, and Portfolio respectively 17 Stock A Stock B 18 19 alpha beta r-squared 20 21 22 Part B. based on your answers in Part A, answer the following questions 23 Which stock had the best performance? 24 Which stock had the worst performance? 25 Which stock is an aggressive asset? 26 Which stock is a defensive asset? 27 What is the economic explanation of the r-squared value for the portfolio? 28 29 30 31 32 33 34 35 36 37 38 39 40 41 12 #2 #3 #4 #5 1 Ready D Stock A return #1 E Stock B return #6 #7 -10.00% 16.99% 13.84% 3.22% -2.58% 20.00% 4.89% 0.13% -10.30% 0.51% 5.73% -11.76% 8.95% #8 F #9 G + H
Step by Step Solution
There are 3 Steps involved in it

Get step-by-step solutions from verified subject matter experts