

Question: A B D 1 Compute the following ratios. Do not round your calculations. 2 (Always use cell references and formulas where appropriate to receive full
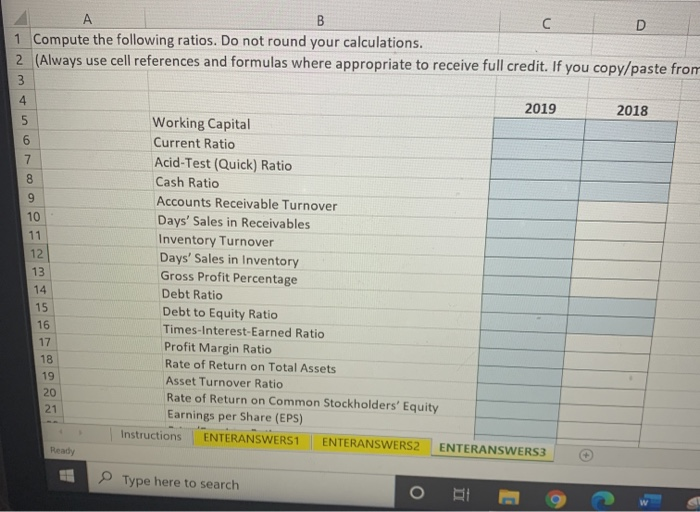
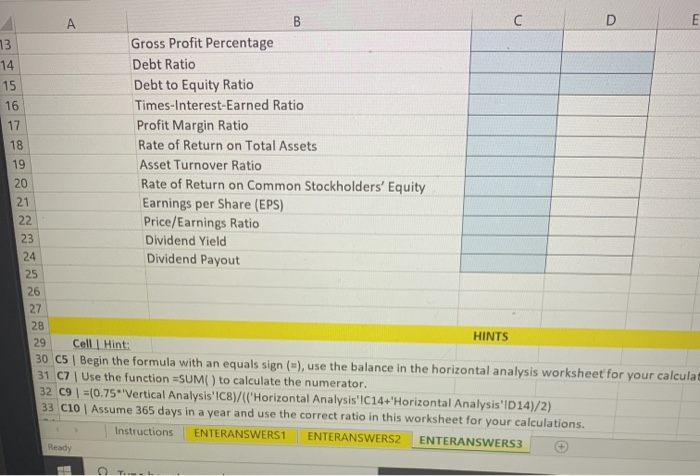
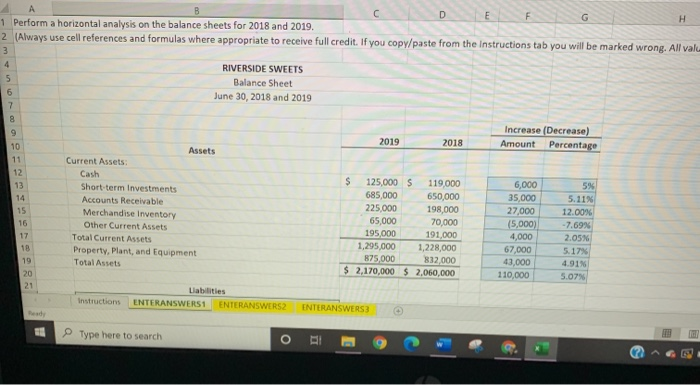
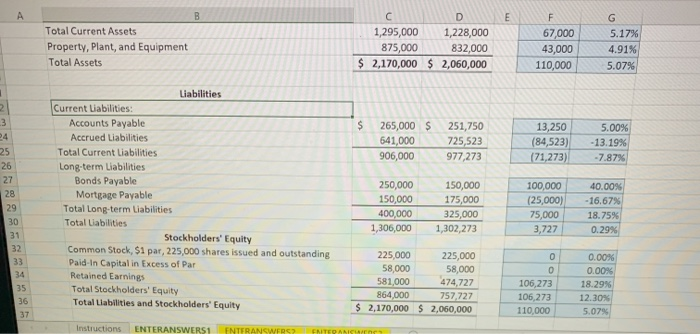
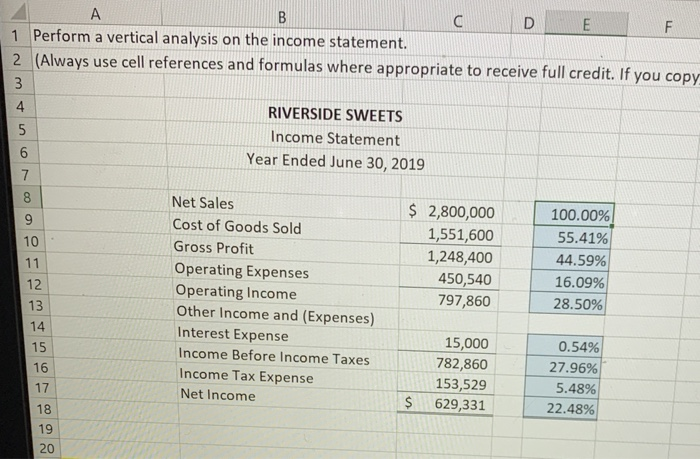
A B D 1 Compute the following ratios. Do not round your calculations. 2 (Always use cell references and formulas where appropriate to receive full credit. If you copy/paste from 3 4 2019 2018 6 7 8 9 10 11 12 13 14 15 16 17 18 19 20 21 Working Capital Current Ratio Acid-Test (Quick) Ratio Cash Ratio Accounts Receivable Turnover Days' Sales in Receivables Inventory Turnover Days' Sales in Inventory Gross Profit Percentage Debt Ratio Debt to Equity Ratio Times-Interest-Earned Ratio Profit Margin Ratio Rate of Return on Total Assets Asset Turnover Ratio Rate of Return on Common Stockholders' Equity Earnings per Share (EPS) Instructions ENTERANSWERS ENTERANSWERS ENTERANSWERS Ready Type here to search B E 73 Gross Profit Percentage 14 Debt Ratio 15 Debt to Equity Ratio 16 Times-Interest-Earned Ratio 17 Profit Margin Ratio 18 Rate of Return on Total Assets 19 Asset Turnover Ratio 20 Rate of Return on Common Stockholders' Equity 21 Earnings per Share (EPS) 22 Price/Earnings Ratio Dividend Yield 24 Dividend Payout 25 26 27 28 29 HINTS Cell Hint: 30 C5 Begin the formula with an equals sign (=), use the balance in the horizontal analysis worksheet for your calculat 31 C7 Use the function =SUM( ) to calculate the numerator. 32 09 | =(0.75*"Vertical Analysis'IC8)/(('Horizontal Analysis'IC 14+'Horizontal Analysis'ID14)/2) 33 C10 Assume 365 days in a year and use the correct ratio in this worksheet for your calculations. Instructions ENTERANSWERS1 ENTERANSWERS ENTERANSWERS Ready 23 FE B C D E F G H 1 Perform a horizontal analysis on the balance sheets for 2018 and 2019. 2 Always use cell references and formulas where appropriate to receive full credit. If you copy/paste from the Instructions tab you will be marked wrong. All valu 3 4 RIVERSIDE SWEETS 5 Balance Sheet 6 June 30, 2018 and 2019 7 2019 Increase (Decrease) Amount Percentage 2018 9 10 11 12 13 14 15 16 17 18 Assets Current Assets Cash Short-term Investments Accounts Receivable Merchandise Inventory Other Current Assets Total Current Assets Property, Plant, and Equipment Total Assets $ 125,000 $ 119,000 685,000 650,000 225,000 198,000 65,000 70,000 195,000 191,000 1,295,000 1,228,000 875 000 832,000 $ 2,170,000 $2,060,000 6,000 35,000 27,000 (5,000) 4,000 67,000 43,000 110,000 5% 5.11% 12.00% -7.69% 2.05% 5.17% 4.91M 5.07% 19 20 21 Instructions Liabilities ENTERANSWERS ENTERANSWERS ENTERANSWERS Type here to search o E B Total Current Assets Property, Plant, and Equipment Total Assets C 1,295,000 1,228,000 875,000 832,000 $ 2,170,000 $ 2,060,000 F 67,000 43,000 110,000 G 5.17% 4.91% 5.07% $ 265,000 $ 641,000 906,000 251,750 725,523 977,273 13,250 (84,523) (71,273) 5.00% - 13.19% -7.87% 2 3 24 25 26 27 28 29 30 31 32 33 34 35 36 37 Liabilities Current Liabilities: Accounts Payable Accrued Liabilities Total Current Liabilities Long-term Liabilities Bonds Payable Mortgage Payable Total Long-term Liabilities Total Labilities Stockholders' Equity Common Stock, $1 par, 225,000 shares issued and outstanding Paid-In Capital in Excess of Par Retained Earnings Total Stockholders' Equity Total Liabilities and Stockholders' Equity 250,000 150,000 400,000 1,306,000 150,000 175,000 325,000 1,302,273 100,000 (25,000) 75,000 3,727 40.00% - 16.67% 18.75% 0.29% 225,000 225,000 58,000 58,000 581,000 474,727 864,000 757,727 $ 2,170,000 $2,060,000 0 0 106,273 106,273 110,000 0.00% 0.00% 18.29% 12.30% 5.07% Instructions ENTERANSWERS1 ENTERANSWERS EMITERISE 3 5 A B E F 1 Perform a vertical analysis on the income statement. 2 (Always use cell references and formulas where appropriate to receive full credit. If you copy 3 4. RIVERSIDE SWEETS 5 Income Statement 6 Year Ended June 30, 2019 7 8 Net Sales $ 2,800,000 100.00% Cost of Goods Sold 1,551,600 55.41% 10 Gross Profit 1,248,400 44.59% 11 Operating Expenses 450,540 16.09% 12 Operating Income 797,860 28.50% 13 Other Income and (Expenses) 14 Interest Expense 15,000 0.54% 15 Income Before Income Taxes 782,860 27.96% 16 Income Tax Expense 153,529 5.48% 17 Net Income $ 629,331 22.48% 18 19 9 20
Step by Step Solution
There are 3 Steps involved in it

Get step-by-step solutions from verified subject matter experts