

Question: A B D E F G H 1 2 3 The company below is a large manufacturer and distributor of electronic components. Because of some
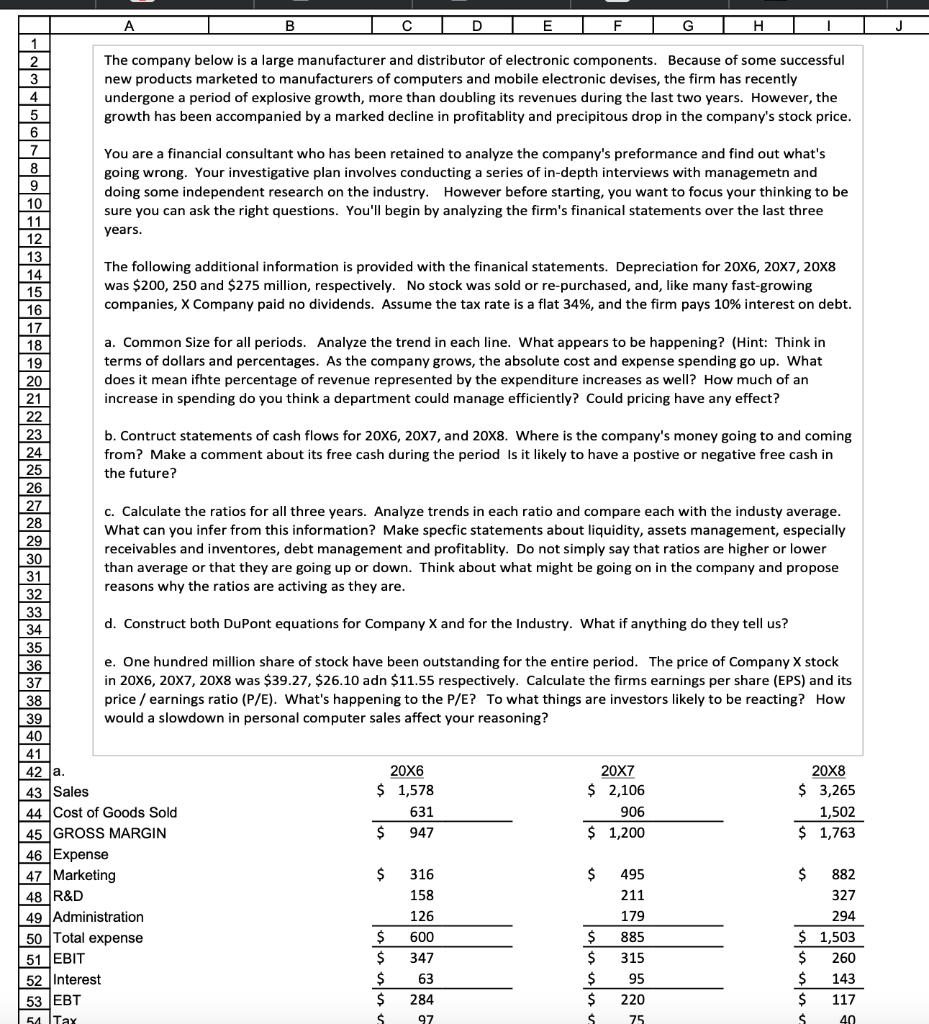
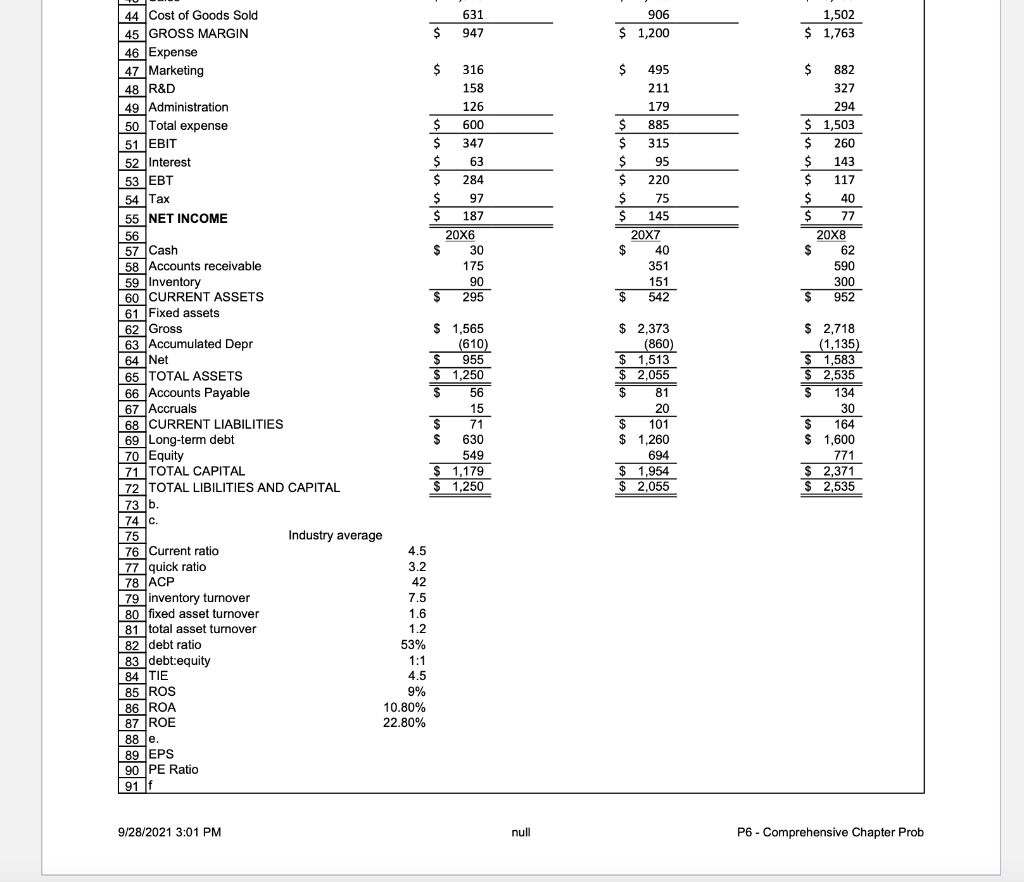
A B D E F G H 1 2 3 The company below is a large manufacturer and distributor of electronic components. Because of some successful new products marketed to manufacturers of computers and mobile electronic devises, the firm has recently undergone a period of explosive growth, more than doubling its revenues during the last two years. However, the growth has been accompanied by a marked decline in profitablity and precipitous drop in the company's stock price. 4 5 6 7 You are a financial consultant who has been retained to analyze the company's preformance and find out what's 8 going wrong. Your investigative plan involves conducting a series of in-depth interviews with managemetn and 9 doing some independent research on the industry. However before starting, you want to focus your thinking to be 10 sure you can ask the right questions. You'll begin by analyzing the firm's finanical statements over the last three 11 years. 12 13 14 The following additional information is provided with the finanical statements. Depreciation for 20X6, 20X7, 20X8 15 was $200, 250 and $275 million, respectively. No stock was sold or re-purchased, and, like many fast-growing 16 companies, X Company paid no dividends. Assume the tax rate is a flat 34%, and the firm pays 10% interest on debt. 17 18 a. Common Size for all periods. Analyze the trend in each line. What appears to be happening? (Hint: Think in 19 terms of dollars and percentages. As the company grows, the absolute cost and expense spending go up. What 20 does it mean ifhte percentage of revenue represented by the expenditure increases as well? How much of an 21 increase in spending do you think a department could manage efficiently? Could pricing have any effect? 22 23 b. Contruct statements of cash flows for 20X6, 20X7, and 20X8. Where is the company's money going to and coming 24 from? Make a comment about its free cash during the period Is it likely to have a postive or negative free cash in 25 the future? 26 27 c. Calculate the ratios for all three years. Analyze trends in each ratio and compare each with the industy average. 28 What can you infer from this information? Make specfic statements about liquidity, assets management, especially 29 receivables and inventores, debt management and profitablity. Do not simply say that ratios are higher or lower 30 than average or that they are going up or down. Think about what might be going on in the company and propose 31 32 reasons why the ratios are activing as they are. 33 34 d. Construct both DuPont equations for Company X and for the Industry. What if anything do they tell us? 35 36 e. One hundred million share of stock have been outstanding for the entire period. The price of Company X stock 37 in 20X6, 20x7, 20X8 was $39.27, $26.10 adn $11.55 respectively. Calculate the firms earnings per share (EPS) and its 38 price / earnings ratio (P/E). What's happening to the P/E? To what things are investors likely to be reacting? How 39 would a slowdown in personal computer sales affect your reasoning? 40 41 42 a. 20X6 20X7 20X8 43 Sales $ 1,578 $ 2,106 $ 3,265 44 Cost of Goods Sold 631 906 1,502 45 GROSS MARGIN $ 947 $ 1,200 $ 1,763 46 Expense 47 Marketing 316 $ 495 882 48 R&D 158 211 327 49 Administration 126 179 294 50 Total expense $ 600 $ 1,503 51 EBIT $ 347 $ 315 $ 260 52 Interest $ 63 $ 95 $ 143 53 EBT $ 284 $ 220 $ 117 5 Inax 97 $ 75 S 40 es 885 Tunalne Tolosales Analno 906 $ 1,200 1,502 $ 1,763 R eg $ 495 211 179 $ 885 $ 315 $ 95 $ 220 $ 75 $ 145 20X7 $ 40 351 151 $ 542 in coluptas 44 Cost of Goods Sold 631 45 GROSS MARGIN $ 947 46 Expense 47 Marketing $ 316 48 R&D 158 49 Administration 126 50 Total expense $ 600 51 EBIT $ 347 52 Interest $ 63 53 EBT $ 284 54 Tax $ 97 55 NET INCOME $ 187 56 20X6 57 Cash $ 30 58 Accounts receivable 175 59 Inventory 90 60 CURRENT ASSETS $ 295 61 Fixed assets 62 Gross $ 1,565 64 Numulated Depr (610) $ 955 65 TOTAL ASSETS $ 1,250 66 Accounts Payable $ 56 67 Accruals 15 68 CURRENT LIABILITIES $ 71 69 Long-term debt $ 630 70 Equity 549 71 TOTAL CAPITAL $ 1,179 72 TOTAL LIBILITIES AND CAPITAL $ 1,250 ** 73 lb. 1 74 C. 75 Industry average 10 76 Current ratio 4.5 - 77 quick ratio 3.2 78 ACP 42 79 inventory turnover 7.5 80 fixed asset turnover 1.6 16 81 total asset turnover 1.2 1.2 82 debt ratio 53% 83 debt:equity 1:1 84 TIE 4.5 85 ROS 9% 86 ROA 10.80% 87 ROE 22.80% 88 e. 89 EPS 90 PE Ratio 91f $ 882 327 294 $ 1,503 $ 260 $ 143 $ 117 $ 40 $ 77 20X8 $ 62 590 300 $ 952 o uslos usuan los al loro $ 2,373 (860) $ 1,513 $ 2,055 $ 81 81 20 $ 101 $ 1,260 694 $ 1,954 $ 2,055 $ 2,718 (1,135) $ 1,583 $ 2,535 $ 134 30 $ 164 $ 1,600 771 $ 2,371 $ 2,535 9/28/2021 3:01 PM null P6 - Comprehensive Chapter Prob A B D E F G H 1 2 3 The company below is a large manufacturer and distributor of electronic components. Because of some successful new products marketed to manufacturers of computers and mobile electronic devises, the firm has recently undergone a period of explosive growth, more than doubling its revenues during the last two years. However, the growth has been accompanied by a marked decline in profitablity and precipitous drop in the company's stock price. 4 5 6 7 You are a financial consultant who has been retained to analyze the company's preformance and find out what's 8 going wrong. Your investigative plan involves conducting a series of in-depth interviews with managemetn and 9 doing some independent research on the industry. However before starting, you want to focus your thinking to be 10 sure you can ask the right questions. You'll begin by analyzing the firm's finanical statements over the last three 11 years. 12 13 14 The following additional information is provided with the finanical statements. Depreciation for 20X6, 20X7, 20X8 15 was $200, 250 and $275 million, respectively. No stock was sold or re-purchased, and, like many fast-growing 16 companies, X Company paid no dividends. Assume the tax rate is a flat 34%, and the firm pays 10% interest on debt. 17 18 a. Common Size for all periods. Analyze the trend in each line. What appears to be happening? (Hint: Think in 19 terms of dollars and percentages. As the company grows, the absolute cost and expense spending go up. What 20 does it mean ifhte percentage of revenue represented by the expenditure increases as well? How much of an 21 increase in spending do you think a department could manage efficiently? Could pricing have any effect? 22 23 b. Contruct statements of cash flows for 20X6, 20X7, and 20X8. Where is the company's money going to and coming 24 from? Make a comment about its free cash during the period Is it likely to have a postive or negative free cash in 25 the future? 26 27 c. Calculate the ratios for all three years. Analyze trends in each ratio and compare each with the industy average. 28 What can you infer from this information? Make specfic statements about liquidity, assets management, especially 29 receivables and inventores, debt management and profitablity. Do not simply say that ratios are higher or lower 30 than average or that they are going up or down. Think about what might be going on in the company and propose 31 32 reasons why the ratios are activing as they are. 33 34 d. Construct both DuPont equations for Company X and for the Industry. What if anything do they tell us? 35 36 e. One hundred million share of stock have been outstanding for the entire period. The price of Company X stock 37 in 20X6, 20x7, 20X8 was $39.27, $26.10 adn $11.55 respectively. Calculate the firms earnings per share (EPS) and its 38 price / earnings ratio (P/E). What's happening to the P/E? To what things are investors likely to be reacting? How 39 would a slowdown in personal computer sales affect your reasoning? 40 41 42 a. 20X6 20X7 20X8 43 Sales $ 1,578 $ 2,106 $ 3,265 44 Cost of Goods Sold 631 906 1,502 45 GROSS MARGIN $ 947 $ 1,200 $ 1,763 46 Expense 47 Marketing 316 $ 495 882 48 R&D 158 211 327 49 Administration 126 179 294 50 Total expense $ 600 $ 1,503 51 EBIT $ 347 $ 315 $ 260 52 Interest $ 63 $ 95 $ 143 53 EBT $ 284 $ 220 $ 117 5 Inax 97 $ 75 S 40 es 885 Tunalne Tolosales Analno 906 $ 1,200 1,502 $ 1,763 R eg $ 495 211 179 $ 885 $ 315 $ 95 $ 220 $ 75 $ 145 20X7 $ 40 351 151 $ 542 in coluptas 44 Cost of Goods Sold 631 45 GROSS MARGIN $ 947 46 Expense 47 Marketing $ 316 48 R&D 158 49 Administration 126 50 Total expense $ 600 51 EBIT $ 347 52 Interest $ 63 53 EBT $ 284 54 Tax $ 97 55 NET INCOME $ 187 56 20X6 57 Cash $ 30 58 Accounts receivable 175 59 Inventory 90 60 CURRENT ASSETS $ 295 61 Fixed assets 62 Gross $ 1,565 64 Numulated Depr (610) $ 955 65 TOTAL ASSETS $ 1,250 66 Accounts Payable $ 56 67 Accruals 15 68 CURRENT LIABILITIES $ 71 69 Long-term debt $ 630 70 Equity 549 71 TOTAL CAPITAL $ 1,179 72 TOTAL LIBILITIES AND CAPITAL $ 1,250 ** 73 lb. 1 74 C. 75 Industry average 10 76 Current ratio 4.5 - 77 quick ratio 3.2 78 ACP 42 79 inventory turnover 7.5 80 fixed asset turnover 1.6 16 81 total asset turnover 1.2 1.2 82 debt ratio 53% 83 debt:equity 1:1 84 TIE 4.5 85 ROS 9% 86 ROA 10.80% 87 ROE 22.80% 88 e. 89 EPS 90 PE Ratio 91f $ 882 327 294 $ 1,503 $ 260 $ 143 $ 117 $ 40 $ 77 20X8 $ 62 590 300 $ 952 o uslos usuan los al loro $ 2,373 (860) $ 1,513 $ 2,055 $ 81 81 20 $ 101 $ 1,260 694 $ 1,954 $ 2,055 $ 2,718 (1,135) $ 1,583 $ 2,535 $ 134 30 $ 164 $ 1,600 771 $ 2,371 $ 2,535 9/28/2021 3:01 PM null P6 - Comprehensive Chapter Prob
Step by Step Solution
There are 3 Steps involved in it

Get step-by-step solutions from verified subject matter experts