

Question: A B D E F G H 3 1 Using the income statement and balance sheet data presented below do the following 2. 1 60pts
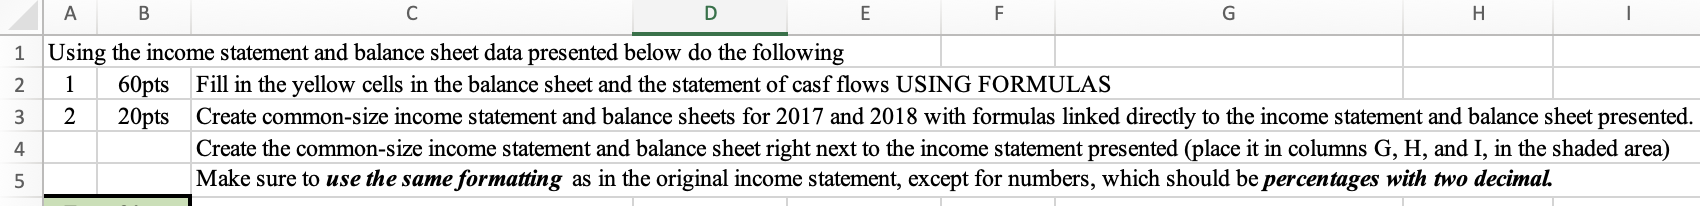
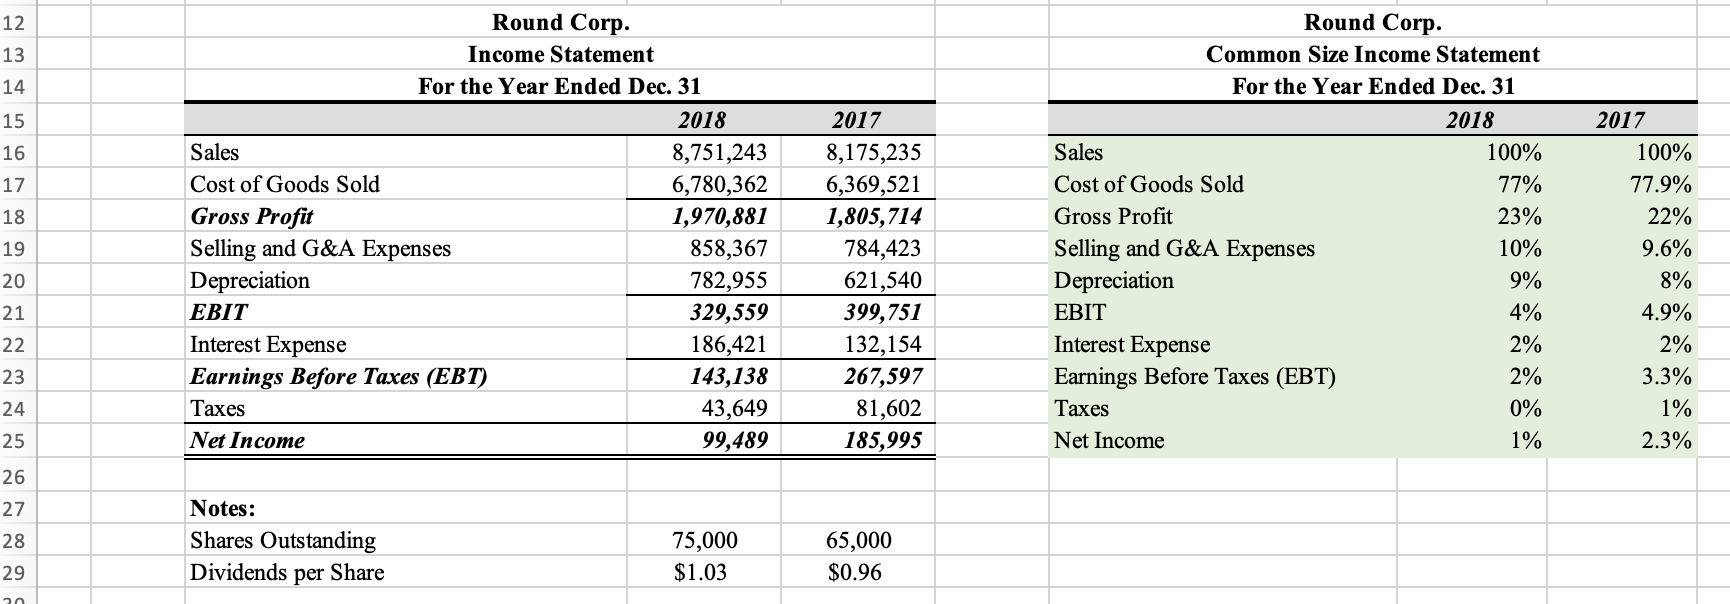
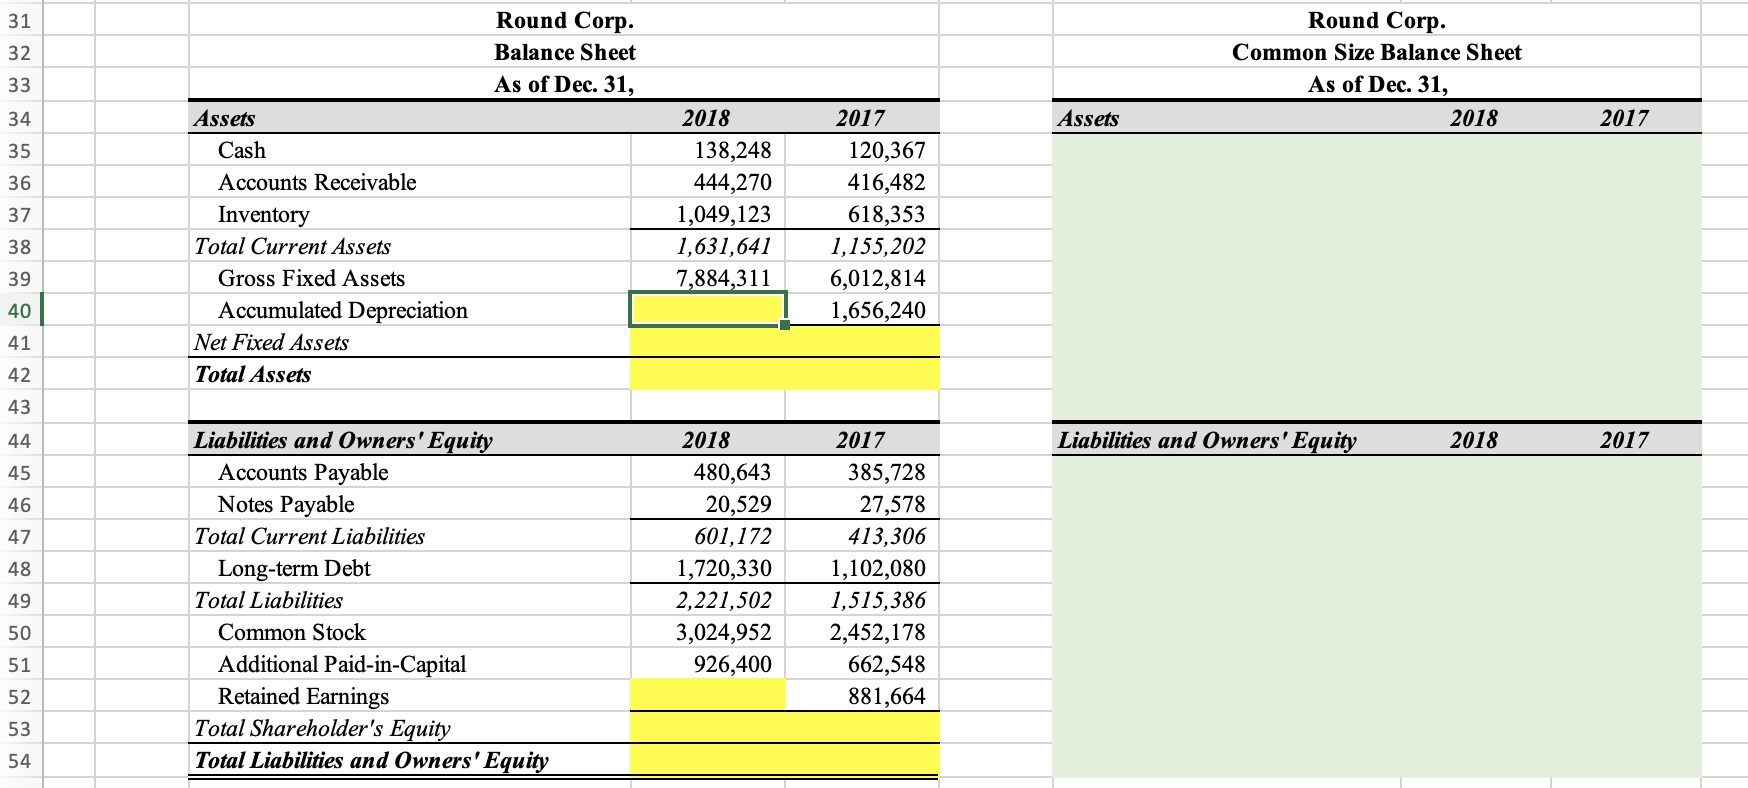
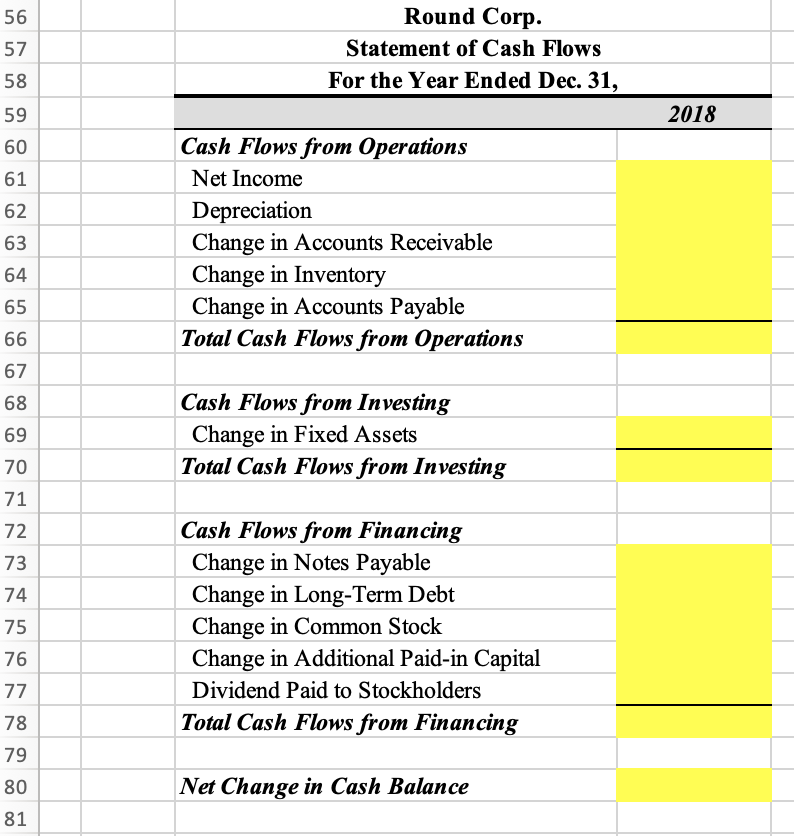
A B D E F G H 3 1 Using the income statement and balance sheet data presented below do the following 2. 1 60pts Fill in the yellow cells in the balance sheet and the statement of casf flows USING FORMULAS 2 20pts Create common-size income statement and balance sheets for 2017 and 2018 with formulas linked directly to the income statement and balance sheet presented. Create the common-size income statement and balance sheet right next to the income statement presented (place it in columns G, H, and I, in the shaded area) Make sure to use the same formatting as in the original income statement, except for numbers, which should be percentages with two decimal. 4 5 12 13 14 15 16 17 18 19 20 Round Corp. Income Statement For the Year Ended Dec. 31 2018 Sales 8,751,243 Cost of Goods Sold 6,780,362 Gross Profit 1,970,881 Selling and G&A Expenses 858,367 Depreciation 782,955 EBIT 329,559 Interest Expense 186,421 Earnings Before Taxes (EBT) 143,138 Taxes 43,649 Net Income 99,489 2017 8,175,235 6,369,521 1,805,714 784,423 621,540 399,751 132,154 267,597 81,602 185,995 2017 100% 77.9% 22% 9.6% Round Corp. Common Size Income Statement For the Year Ended Dec. 31 2018 Sales 100% Cost of Goods Sold 77% Gross Profit 23% Selling and G&A Expenses 10% Depreciation 9% EBIT 4% Interest Expense 2% Earnings Before Taxes (EBT) 2% Taxes 0% Net Income 8% 21 22 23 4.9% 2% 3.3% 1% 2.3% 24 25 26 27 28 29 Notes: Shares Outstanding Dividends per Share 75,000 $1.03 65,000 $0.96 31 32 33 Round Corp. Balance Sheet As of Dec. 31, Round Corp. Common Size Balance Sheet As of Dec. 31, 2018 34 Assets 2017 35 36 2018 138,248 444,270 1,049,123 1,631,641 7,884,311 37 Assets Cash Accounts Receivable Inventory Total Current Assets Gross Fixed Assets Accumulated Depreciation Net Fixed Assets Total Assets 2017 120,367 416,482 618,353 1,155,202 6,012,814 1,656,240 38 39 40 41 42 43 44 Liabilities and Owners' Equity 2018 2017 45 46 47 2018 480,643 20,529 601,172 1,720,330 2,221,502 3,024,952 926,400 48 Liabilities and Owners' Equity Accounts Payable Notes Payable Total Current Liabilities Long-term Debt Total Liabilities Common Stock Additional Paid-in-Capital Retained Earnings Total Shareholder's Equity Total Liabilities and Owners' Equity 2017 385,728 27,578 413,306 1,102,080 1,515,386 2,452,178 662,548 881,664 49 50 51 52 53 54 56 57 58 Round Corp. Statement of Cash Flows For the Year Ended Dec. 31, 59 2018 60 61 62 63 Cash Flows from Operations Net Income Depreciation Change in Accounts Receivable Change in Inventory Change in Accounts Payable Total Cash Flows from Operations 64 65 66 67 68 69 Cash Flows from Investing Change in Fixed Assets Total Cash Flows from Investing 70 71 72 73 74 75 Cash Flows from Financing Change in Notes Payable Change in Long-Term Debt Change in Common Stock Change in Additional Paid-in Capital Dividend Paid to Stockholders Total Cash Flows from Financing 76 77 78 79 80 Net Change in Cash Balance 81
Step by Step Solution
There are 3 Steps involved in it

Get step-by-step solutions from verified subject matter experts