

Question: A B D E F G H J K L P Chart: Problem 4) Now, repeat the exact same calculations as Problem 3 for a
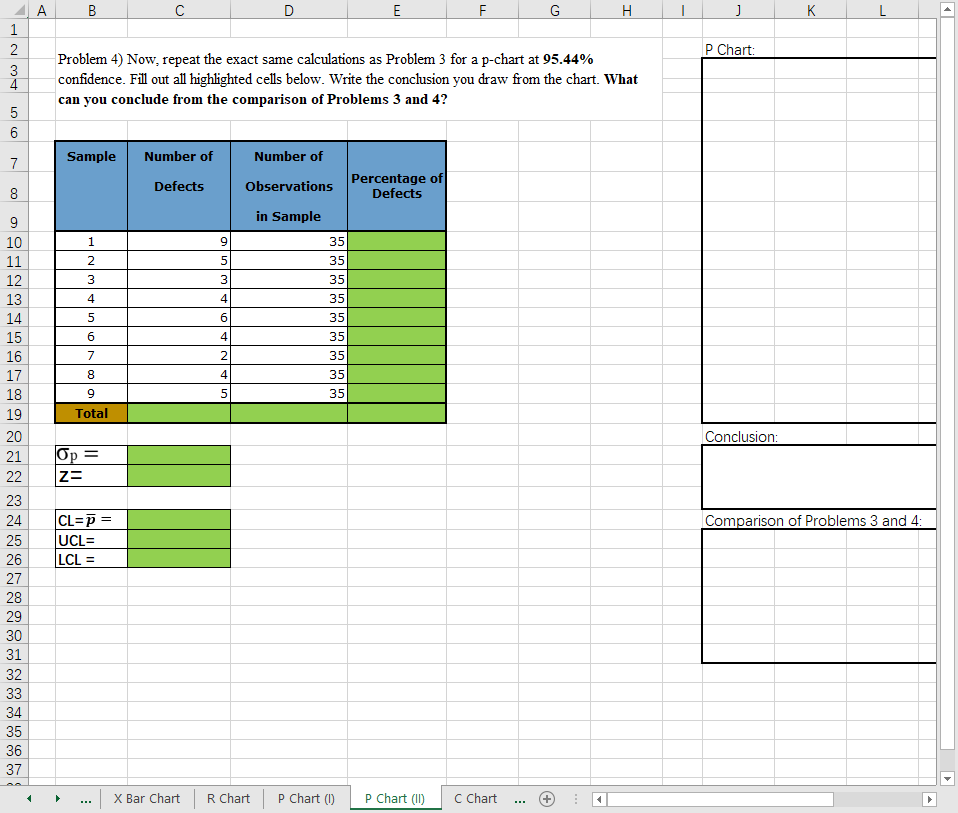

A B D E F G H J K L P Chart: Problem 4) Now, repeat the exact same calculations as Problem 3 for a p-chart at 95.44% confidence. Fill out all highlighted cells below. Write the conclusion you draw from the chart. What can you conclude from the comparison of Problems 3 and 4? Sample Number of Number of Percentage of Defects Observations 8 Defects in Sample 10 35 11 35 12 35 13 35 M A N A O A W U ID D CO NO MI A W N H 35 35 16 35 17 35 18 35 19 Total 20 Conclusion: 21 Op = 22 Z= 23 24 CL=p = Comparison of Problems 3 and 4: 25 UCL= 26 LCL = 27 28 29 30 31 32 33 34 35 36 37 ... X Bar Chart R Chart P Chart (1) P Chart (II) C Chart ... +
Step by Step Solution
There are 3 Steps involved in it

Get step-by-step solutions from verified subject matter experts