

Question: A B D E F G H J K L 1 Nm Account Number Last Name 367459 Hyat First Name Kato 4 5 Standard Deviation
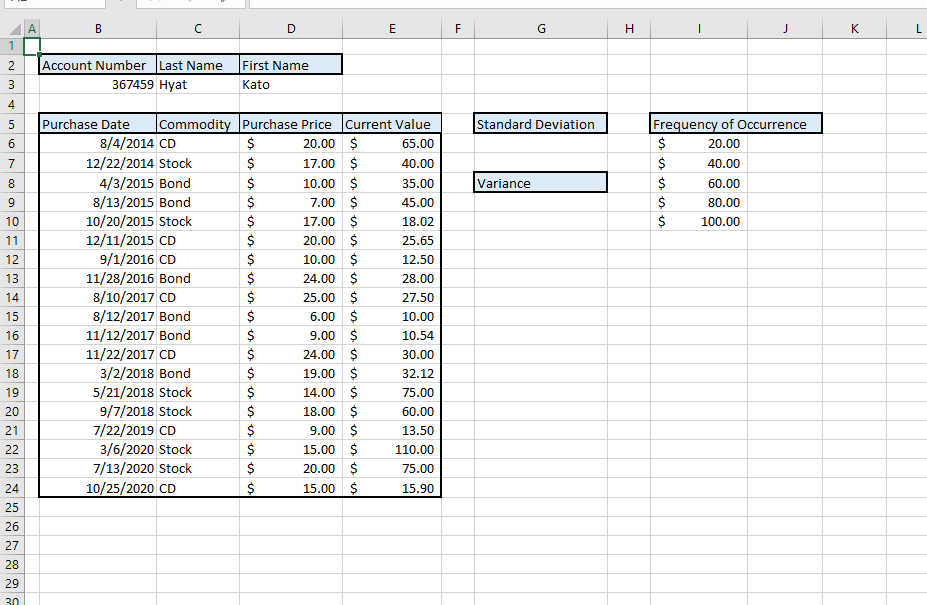
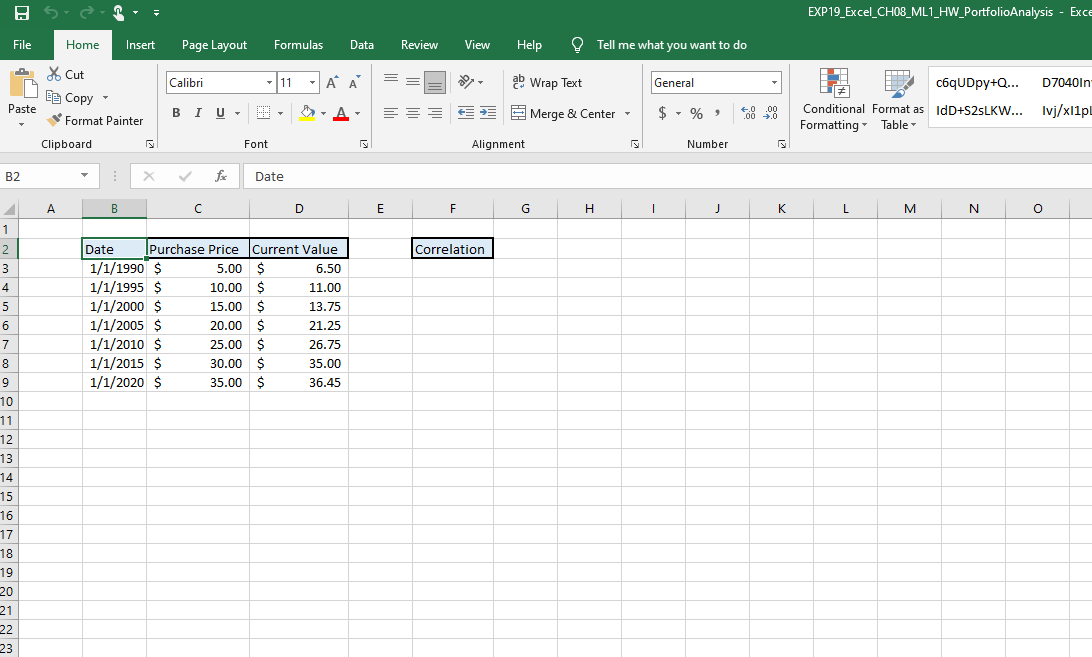
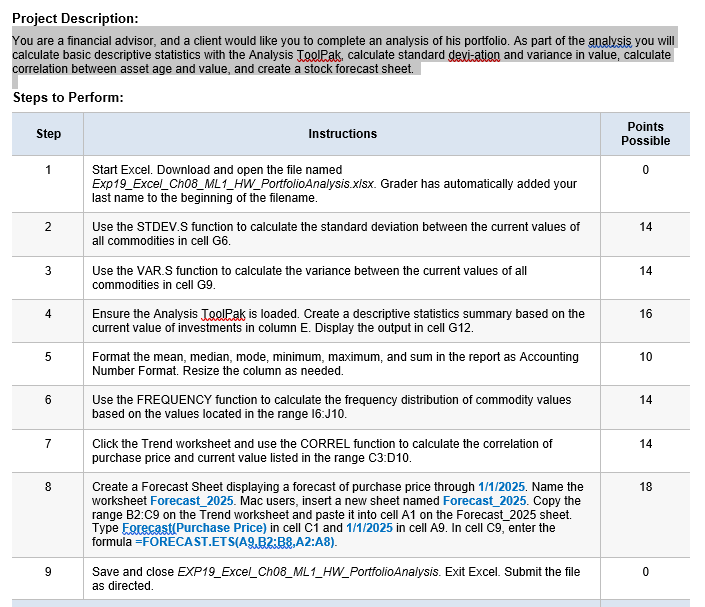
A B D E F G H J K L 1 Nm Account Number Last Name 367459 Hyat First Name Kato 4 5 Standard Deviation 6 7 Frequency of Occurrence $ 20.00 $ 40.00 $ 60.00 $ 80.00 $ 100.00 Variance 8 9 10 11 12 13 14 Purchase Date Commodity Purchase Price Current Value 8/4/2014 CD $ 20.00 $ 65.00 12/22/2014 Stock $ 17.00 $ 40.00 4/3/2015 Bond $ 10.00 $ 35.00 8/13/2015 Bond $ 7.00 $ 45.00 10/20/2015 Stock $ 17.00 $ 18.02 12/11/2015 CD $ 20.00 $ 25.65 9/1/2016 CD $ 10.00 $ 12.50 11/28/2016 Bond $ 24.00 $ 28.00 8/10/2017 CD $ 25.00 $ 27.50 8/12/2017 Bond $ 6.00 $ 10.00 11/12/2017 Bond $ 9.00 $ 10.54 11/22/2017 CD $ 24.00 $ 30.00 3/2/2018 Bond $ 19.00 $ 32.12 5/21/2018 Stock $ 14.00 $ 75.00 9/7/2018 Stock $ 18.00 $ 60.00 7/22/2019 CD $ 9.00 $ 13.50 3/6/2020 Stock $ 15.00 $ 110.00 7/13/2020 Stock $ 20.00 $ 75.00 10/25/2020 CD $ 15.00 $ 15.90 15 16 17 18 19 20 21 22 23 24 25 26 27 28 29 30 EXP19_Excel_CH08_ML1_HW_PortfolioAnalysis - Exce File Home Insert Page Layout Formulas Data Review View Help Tell me what you want to do Calibri 11 AA ab Wrap Text General * Cut 6 Copy Paste Format Painter Clipboard BIU c6qUDpy+Q... D7040ln Conditional Format as IdD+S2sLKW... Tvj/xl1pL Formatting Table Merge & Center - +0.00 .00 0 $ - % Font Alignment Number B2 X f Date A B D E F H 1 J K L M N O Correlation 1 2 3 4 5 Date Purchase Price Current Value 1/1/1990 $ 5.00 $ 6.50 1/1/1995 $ 10.00 $ 11.00 1/1/2000 $ 15.00 $ 13.75 1/1/2005 $ 20.00 $ 21.25 1/1/2010 $ 25.00 $ 26.75 1/1/2015 $ 30.00 $ 35.00 1/1/2020 $ 35.00 $ 36.45 6 7 8 9 10 11 12 13 14 15 16 17 18 19 20 21 22 23 Project Description: You are a financial advisor, and a client would like you to complete an analysis of his portfolio. As part of the analysis you will calculate basic descriptive statistics with the Analysis ToolPak, calculate standard deviation and variance in value, calculate correlation between asset age and value, and create a stock forecast sheet. Steps to Perform: Step Instructions Points Possible 1 0 2 14 3 14 4 16 5 10 Start Excel. Download and open the file named Exp19_Excel_Cho8_ML1_HW_Portfolio Analysis.xlsx. Grader has automatically added your last name to the beginning of the filename. Use the STDEV.S function to calculate the standard deviation between the current values of all commodities in cell G6. Use the VAR.S function to calculate the variance between the current values of all commodities in cell G9. Ensure the Analysis ToolPak is loaded. Create a descriptive statistics summary based on the current value of investments in column E. Display the output in cell G12. Format the mean, median, mode, minimum, maximum, and sum in the report as Accounting Number Format. Resize the column as needed. Use the FREQUENCY function to calculate the frequency distribution of commodity values based on the values located in the range 16:J10. Click the Trend worksheet and use the CORREL function to calculate the correlation of purchase price and current value listed in the range C3:010. Create a Forecast Sheet displaying a forecast of purchase price through 1/1/2025. Name the worksheet Forecast_2025. Mac users, insert a new sheet named Forecast_2025. Copy the range B2:C9 on the Trend worksheet and paste it into cell A1 on the Forecast_2025 sheet. Type Forecast(Purchase Price) in cell ci and 1/1/2025 in cell A9. In cell C9, enter the formula =FORECAST.ETS(A2,B2:B8, A2:A8). Save and close EXP19_Excel_Cho8_ML1_HW_Portfolio Analysis. Exit Excel. Submit the file as directed. 6 14 7 14 8 18 9 0 A B D E F G H J K L 1 Nm Account Number Last Name 367459 Hyat First Name Kato 4 5 Standard Deviation 6 7 Frequency of Occurrence $ 20.00 $ 40.00 $ 60.00 $ 80.00 $ 100.00 Variance 8 9 10 11 12 13 14 Purchase Date Commodity Purchase Price Current Value 8/4/2014 CD $ 20.00 $ 65.00 12/22/2014 Stock $ 17.00 $ 40.00 4/3/2015 Bond $ 10.00 $ 35.00 8/13/2015 Bond $ 7.00 $ 45.00 10/20/2015 Stock $ 17.00 $ 18.02 12/11/2015 CD $ 20.00 $ 25.65 9/1/2016 CD $ 10.00 $ 12.50 11/28/2016 Bond $ 24.00 $ 28.00 8/10/2017 CD $ 25.00 $ 27.50 8/12/2017 Bond $ 6.00 $ 10.00 11/12/2017 Bond $ 9.00 $ 10.54 11/22/2017 CD $ 24.00 $ 30.00 3/2/2018 Bond $ 19.00 $ 32.12 5/21/2018 Stock $ 14.00 $ 75.00 9/7/2018 Stock $ 18.00 $ 60.00 7/22/2019 CD $ 9.00 $ 13.50 3/6/2020 Stock $ 15.00 $ 110.00 7/13/2020 Stock $ 20.00 $ 75.00 10/25/2020 CD $ 15.00 $ 15.90 15 16 17 18 19 20 21 22 23 24 25 26 27 28 29 30 EXP19_Excel_CH08_ML1_HW_PortfolioAnalysis - Exce File Home Insert Page Layout Formulas Data Review View Help Tell me what you want to do Calibri 11 AA ab Wrap Text General * Cut 6 Copy Paste Format Painter Clipboard BIU c6qUDpy+Q... D7040ln Conditional Format as IdD+S2sLKW... Tvj/xl1pL Formatting Table Merge & Center - +0.00 .00 0 $ - % Font Alignment Number B2 X f Date A B D E F H 1 J K L M N O Correlation 1 2 3 4 5 Date Purchase Price Current Value 1/1/1990 $ 5.00 $ 6.50 1/1/1995 $ 10.00 $ 11.00 1/1/2000 $ 15.00 $ 13.75 1/1/2005 $ 20.00 $ 21.25 1/1/2010 $ 25.00 $ 26.75 1/1/2015 $ 30.00 $ 35.00 1/1/2020 $ 35.00 $ 36.45 6 7 8 9 10 11 12 13 14 15 16 17 18 19 20 21 22 23 Project Description: You are a financial advisor, and a client would like you to complete an analysis of his portfolio. As part of the analysis you will calculate basic descriptive statistics with the Analysis ToolPak, calculate standard deviation and variance in value, calculate correlation between asset age and value, and create a stock forecast sheet. Steps to Perform: Step Instructions Points Possible 1 0 2 14 3 14 4 16 5 10 Start Excel. Download and open the file named Exp19_Excel_Cho8_ML1_HW_Portfolio Analysis.xlsx. Grader has automatically added your last name to the beginning of the filename. Use the STDEV.S function to calculate the standard deviation between the current values of all commodities in cell G6. Use the VAR.S function to calculate the variance between the current values of all commodities in cell G9. Ensure the Analysis ToolPak is loaded. Create a descriptive statistics summary based on the current value of investments in column E. Display the output in cell G12. Format the mean, median, mode, minimum, maximum, and sum in the report as Accounting Number Format. Resize the column as needed. Use the FREQUENCY function to calculate the frequency distribution of commodity values based on the values located in the range 16:J10. Click the Trend worksheet and use the CORREL function to calculate the correlation of purchase price and current value listed in the range C3:010. Create a Forecast Sheet displaying a forecast of purchase price through 1/1/2025. Name the worksheet Forecast_2025. Mac users, insert a new sheet named Forecast_2025. Copy the range B2:C9 on the Trend worksheet and paste it into cell A1 on the Forecast_2025 sheet. Type Forecast(Purchase Price) in cell ci and 1/1/2025 in cell A9. In cell C9, enter the formula =FORECAST.ETS(A2,B2:B8, A2:A8). Save and close EXP19_Excel_Cho8_ML1_HW_Portfolio Analysis. Exit Excel. Submit the file as directed. 6 14 7 14 8 18 9 0
Step by Step Solution
There are 3 Steps involved in it

Get step-by-step solutions from verified subject matter experts