

Question: A B D E F G J K L M N P Q R S T U V W X Consolidated Balance Sheets -
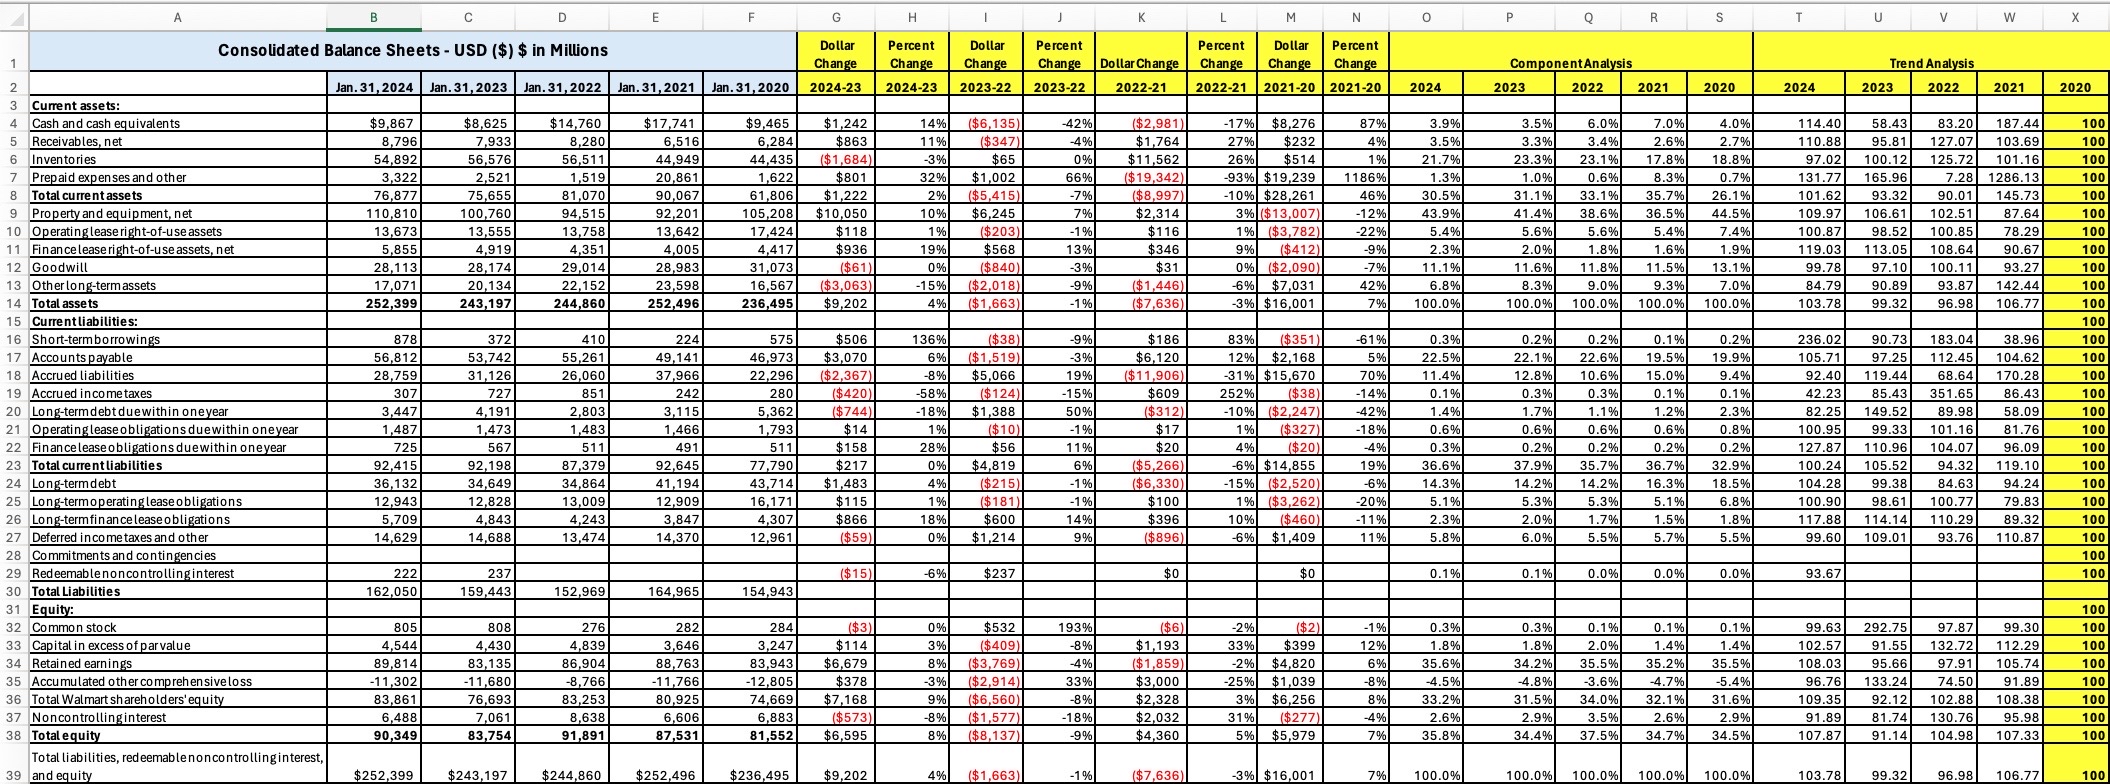
A B D E F G J K L M N P Q R S T U V W X Consolidated Balance Sheets - USD ($) $ in Millions 1 2 Jan. 31,2024 Jan. 31,2023 Jan. 31, 2022 Jan. 31, 2021 Jan. 31, 2020 Dollar Percent Change Change 2024-23 2024-23 2023-22 2023-22 Dollar Percent Change Change Dollar Change 2022-21 Percent Dollar Percent Change Change Change 2022-21 2021-20 2021-20 Component Analysis Trend Analysis 2024 2023 2022 2021 2020 2024 2023 2022 2021 2020 3 Current assets: 4 Cash and cash equivalents 5 6 Inventories 7 8 Total current assets 9 Receivables, net Prepaid expenses and other Property and equipment, net $9,867 8,796 54,892 $8,625 $14,760 $17,741 7,933 56,576 8,280 56,511 6,516 $9,465 6,284 $1,242 $863 14% ($6,135) -42% ($2,981) 11% ($347) -4% $1,764 44,949 44,435 ($1,684) -3% $65 0% $11,562 3,322 2,521 1,519 20,861 1,622 $801 32% $1,002 66% ($19,342) -17% $8,276 27% $232 26% -93% $19,239 87% 4% $514 1% 1186% 3.9% 3.5% 21.7% 1.3% 3.5% 6.0% 7.0% 4.0% 76,877 75,655 81,070 90,067 61,806 $1,222 2% ($5,415) -7% ($8,997) -10% $28,261 46% 30.5% 3.3% 3.4% 2.7% 23.3% 23.1% 17.8% 18.8% 1.0% 0.6% 8.3% 0.7% 31.1% 33.1% 35.7% 26.1% 2.6% 110,810 100,760 94,515 92,201 105,208 $10,050 10% $6,245 7% $2,314 3% ($13,007) -12% 43.9% 41.4% 38.6% 36.5% 44.5% 10 Operating lease right-of-use assets 13,673 13,555 13,758 13,642 17,424 $118 1% ($203) -1% $116 1% ($3,782) -22% 5.4% 11 Finance lease right-of-use assets, net 5,855 4,919 4,351 4,005 4,417 $936 19% $568 13% $346 9% ($412) -9% 2.3% 5.6% 2.0% 5.6% 1.8% 5.4% 1.6% 12 Goodwill 28,113 28,174 29,014 28,983 31,073 ($61) 0% ($840) -3% $31 0% ($2,090) -7% 13 Other long-term assets 17,071 14 Total assets 15 Current liabilities: 16 Short-term borrowings 17 Accounts payable 252,399 20,134 243,197 22,152 23,598 244,860 252,496 16,567 236,495 ($3,063) -15% ($2,018) -9% $9,202 4% ($1,663) -1% ($1,446) ($7,636) -6% $7,031 -3% $16,001 42% 7% 11.1% 6.8% 100.0% 11.6% 11.8% 8.3% 100.0% 100.0% 11.5% 7.4% 1.9% 13.1% 114.40 58.43 83.20 187.44 110.88 95.81 127.07 103.69 97.02 100.12 125.72 101.16 131.77 165.96 7.28 101.62 93.32 90.01 109.97 106.61 102.51 100.87 98.52 100.85 119.03 113.05 108.64 100 100 100 1286.13 100 145.73 100 87.64 100 78.29 100 90.67 100 99.78 97.10 100.11 93.27 100 9.0% 9.3% 100.0% 7.0% 84.79 90.89 93.87 142.44 100 100.0% 103.78 99.32 96.98 106.77 100 100 18 Accrued liabilities 878 56,812 28,759 372 53,742 31,126 410 55,261 26,060 224 49,141 575 46,973 $506 $3,070 136% ($38) -9% 6% ($1,519) -3% 37,966 22,296 ($2,367) -8% $5,066 19% 19 Accrued income taxes 307 727 851 242 280 ($420) -58% ($124) -15% $186 $6,120 ($11,906) $609 83% ($351) -61% 0.3% 12% $2,168 5% 22.5% 0.2% 0.2% 22.1% 22.6% 19.5% 0.1% 0.2% 19.9% 236.02 90.73 183.04 38.96 100 -31% $15,670 70% 11.4% 12.8% 10.6% 15.0% 9.4% 252% ($38) -14% 0.1% 0.3% 0.3% 0.1% 0.1% 105.71 92.40 119.44 42.23 20 Long-term debt due within one year 3,447 4,191 2,803 3,115 5,362 ($744) -18% $1,388 50% ($312) -10% ($2,247) -42% 1.4% 1.7% 1.1% 1.2% 2.3% 82.25 149.52 21 Operating lease obligations due within one year 1,487 1,473 1,483 1,466 1,793 $14 1% ($10) -1% $17 1% ($327) -18% 0.6% 0.6% 0.6% 0.6% 0.8% 100.95 97.25 112.45 104.62 68.64 170.28 85.43 351.65 86.43 89.98 99.33 101.16 100 100 100 58.09 100 81.76 100 22 Finance lease obligations due within one year 725 567 511 491 511 $158 28% $56 11% $20 4% ($20) -4% 0.3% 0.2% 0.2% 0.2% 0.2% 23 Total current liabilities 24 Long-term debt 25 Long-termoperating lease obligations 26 Long-term finance lease obligations 92,415 92,198 87,379 92,645 77,790 $217 0% $4,819 6% ($5,266) -6% $14,855 19% 36,132 34,649 34,864 41,194 43,714 $1,483 4% ($215) -1% ($6,330) -15% ($2,520) -6% 12,943 12,828 13,009 12,909 16,171 $115 1% ($181) -1% $100 1% ($3,262) -20% 36.6% 14.3% 5.1% 37.9% 35.7% 36.7% 32.9% 14.2% 14.2% 16.3% 18.5% 5.3% 5.3% 5.1% 6.8% 5,709 4,843 4,243 3,847 4,307 $866 18% $600 14% $396 10% ($460) -11% 2.3% 2.0% 1.7% 1.5% 1.8% 127.87 110.96 104.07 100.24 105.52 94.32 119.10 104.28 99.38 100.90 98.61 117.88 114.14 96.09 100 100 84.63 100.77 110.29 94.24 100 79.83 89.32 100 100 27 Deferred income taxes and other 14,629 14,688 13,474 14,370 12,961 ($59) 0% $1,214 9% ($896) -6% $1,409 11% 5.8% 6.0% 5.5% 5.7% 5.5% 99.60 109.01 93.76 110.87 100 100 28 Commitments and contingencies 29 Redeemable noncontrolling interest 222 30 Total Liabilities 162,050 237 159,443 ($15) -6% $237 $0 $0 0.1% 0.1% 0.0% 0.0% 0.0% 93.67 100 152,969 164,965 154,943 31 Equity: 100 32 Common stock 33 Capital in excess of par value 805 4,544 808 4,430 34 Retained earnings 89,814 83,135 276 4,839 86,904 282 3,646 88,763 35 Accumulated other comprehensive loss -11,302 -11,680 -8,766 -11,766 284 3,247 83,943 -12,805 ($3) 0% $532 193% ($6) 36 Total Walmart shareholders' equity 83,861 76,693 83,253 80,925 74,669 $114 $6,679 $378 $7,168 3% ($409) -8% 8% ($3,769) -4% -3% ($2,914) 33% $1,193 ($1,859) $3,000 -2% 33% $399 -2% $4,820 -25% $1,039 ($2) -1% 0.3% 0.3% 0.1% 0.1% 0.1% 99.63 292.75 12% 1.8% 1.8% 2.0% 1.4% 1.4% 6% 35.6% 34.2% 35.5% -8% -4.5% 37 Noncontrolling interest 38 Total equity 39 and equity 6,488 90,349 7,061 83,754 8,638 91,891 6,606 87,531 6,883 81,552 ($573) $6,595 9% -8% ($1,577) 8% ($8,137) ($6,560) -8% $2,328 3% $6,256 8% -18% -9% $2,032 31% ($277) -4% $4,360 5% $5,979 7% 33.2% 2.6% 35.8% 35.2% 35.5% -4.8% -3.6% -4.7% -5.4% 31.5% 34.0% 32.1% 31.6% 2.9% 3.5% 2.6% 2.9% 34.4% 37.5% 34.7% 34.5% 97.87 102.57 91.55 132.72 112.29 108.03 95.66 97.91 105.74 96.76 133.24 74.50 109.35 92.12 102.88 91,89 81.74 130.76 95.98 107.87 91.14 104.98 107.33 99.30 100 100 100 91.89 100 108.38 100 100 100 Total liabilities, redeemable noncontrolling interest, $252,399 $243,197 $244,860 $252,496 $236,495 $9,202 4% ($1,663) -1% ($7,636) -3% $16,001 7% 100.0% 100.0% 100.0% 100.0% 100.0% 103.78 99.32 96.98 106.77 100
Step by Step Solution
There are 3 Steps involved in it

Get step-by-step solutions from verified subject matter experts