

Question: ( a ) ( b ) frequency ( ( mathrm { Hz } ) ) Figure 1 A pulse wave and its
a
b
frequency mathrmHz
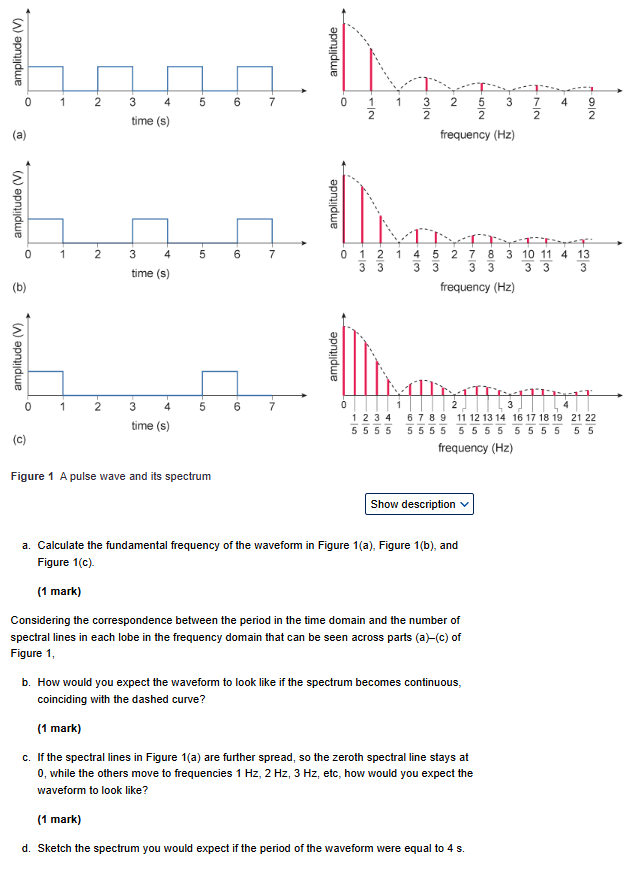
Figure A pulse wave and its spectrum
a Calculate the fundamental frequency of the waveform in Figure a Figure b and Figure c
mark
Considering the correspondence between the period in the time domain and the number of spectral lines in each lobe in the frequency domain that can be seen across parts ac of Figure
b How would you expect the waveform to look like if the spectrum becomes continuous, coinciding with the dashed curve?
mark
c If the spectral lines in Figure a are further spread, so the zeroth spectral line stays at while the others move to frequencies mathrm~Hzmathrm~Hzmathrm~Hz etc, how would you expect the waveform to look like?
mark
d Sketch the spectrum you would expect if the period of the waveform were equal to s
Step by Step Solution
There are 3 Steps involved in it
1 Expert Approved Answer
Step: 1 Unlock

Question Has Been Solved by an Expert!
Get step-by-step solutions from verified subject matter experts
Step: 2 Unlock
Step: 3 Unlock