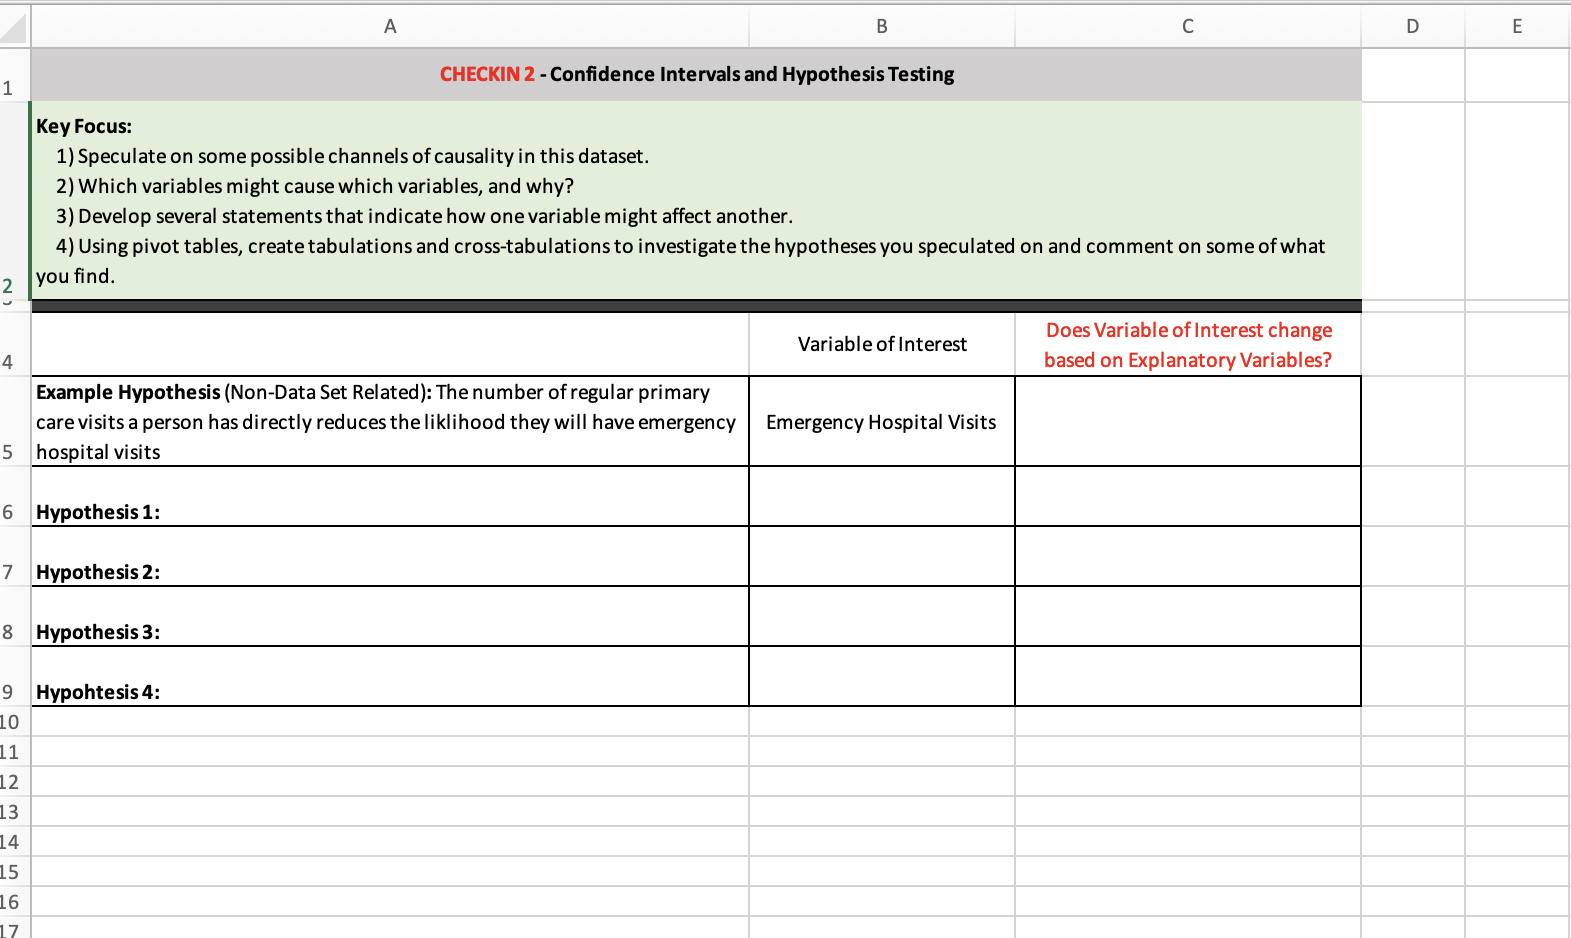
Question: A B G CHECKIN 2 - Confidence Intervals and Hypothesis Testing Key Focus: 1) Speculate on some possible channels of causality in this dataset. 2)

A B G CHECKIN 2 - Confidence Intervals andA B G CHECKIN 2 - Confidence Intervals and
A B G CHECKIN 2 - Confidence Intervals and Hypothesis Testing Key Focus: 1) Speculate on some possible channels of causality in this dataset. 2) Which variables might cause which variables, and why? 3) Develop several statements that indicate how one variable might affect another. 4) Using pivot tables, create tabulations and cross-tabulations to investigate the hypotheses you speculated on and comment on some of what you find. Does Variable of Interest change Variable of Interest . based on Explanatory Variables? Example Hypothesis (Non-Data Set Related): The number of regular primary care visits a person has directly reduces the liklihood they will have emergency | Emergency Hospital Visits hospital visits Hypothesis 1: Hypothesis 2: Hypothesis 3: Hypohtesis 4: . Navigate to the Check-in 2 tab of the Summative Assignment Template you downloaded from the Summative Data-Analysis Assignment Overview page. . Speculate on some possible channels of causality in this dataset. a. Which variables might cause which variables, and why? i. Do not run any analyses for this assignment; just try to think of some convincing stories about why certain variables might cause other variables. b. This format will be useful. i. A > + B (explanation) would be used to indicate that variable A has a positive effect on variable B, followed by an explanation. . Using pivot tables, create tabulations and cross-tabulations of the variables to investigate the hypotheses you speculated on and comment on some of what you find. a. In particular, you want to know whether the variable of interest differs based on different levels of the explanatory variables. . If the explanatory variable is already categorical, then you can directly use it in a tabulation. a. If it is continuous, then you can discretize it by converting it into a low/high variable (usually splitting at the median) or a low/medium/high variable (many ways to split, but one option is 75th percentile). . First, use a single tabulation (look at the mean of hospital days) for different values of the explanatory variables. a. Then try to think of possible two-way cross-tabulations, where you look at how hospital day varies across two variables (e.g., how does the value of hospital change across categories of \"number of different physicians seen per decedent\")

Step by Step Solution

There are 3 Steps involved in it

1 Expert Approved Answer
Step: 1 Unlock blur-text-image
Question Has Been Solved by an Expert!

Get step-by-step solutions from verified subject matter experts

Step: 2 Unlock
Step: 3 Unlock

Students Have Also Explored These Related Mathematics Questions!