

Question: A back-to-back stem-and-leaf plot compares two data sets by using the same stems for each data set. Leaves for the first data set are on
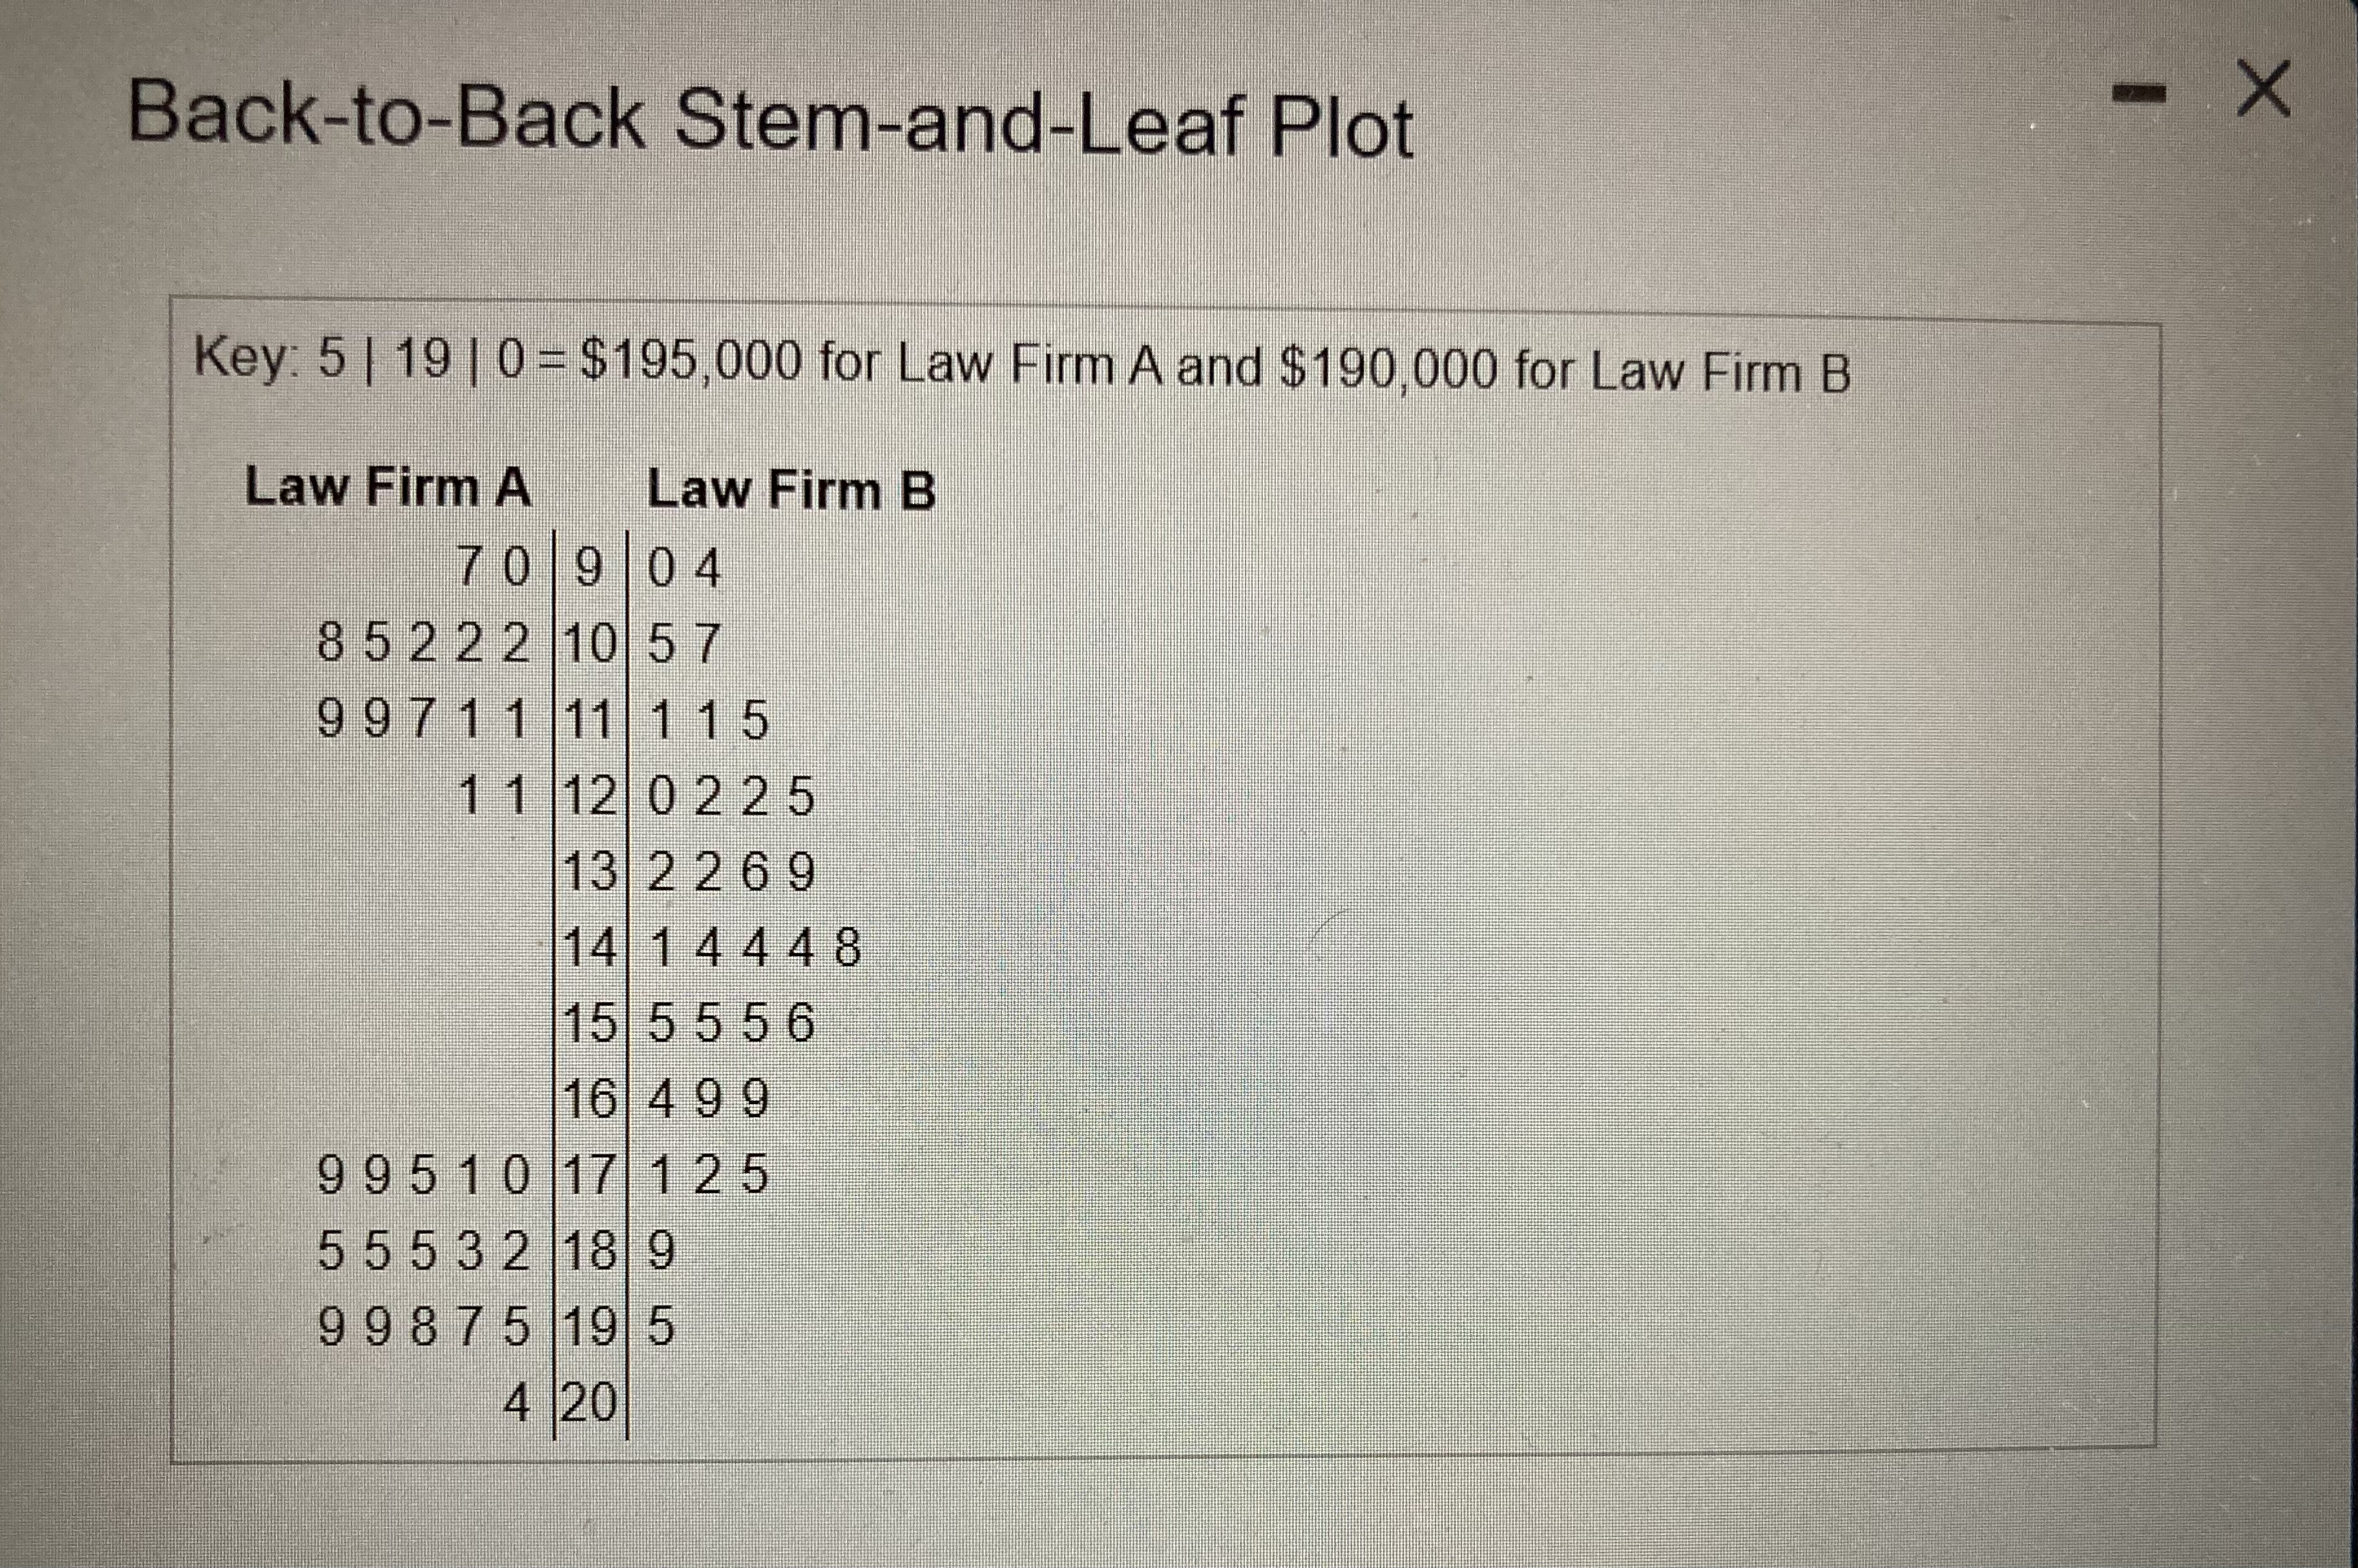
A back-to-back stem-and-leaf plot compares two data sets by using the same stems for each data set. Leaves for the first data set are on one side while leaves for the second data set are on the other side. The back-to-back stem-and-leaf plot available below shows the salaries (in thousands) of all lawyers at two small law firms. Complete parts (a) and (b) below. Click the icon to view the back-to-back stem-and-leaf plot (a) What are the lowest and highest salaries at Law Firm A? at Law Firm B? How many lawyers are in each firm? At Law Firm A the lowest salary was $ and the highest salary was $ At Law Firm B the lowest salary was $ and the highest salary was $Back-to-Back Stem-and-Leaf Plot X Key: 5 | 19 | 0 = $195,000 for Law Firm A and $190,000 for Law Firm B Law Firm A Law Firm B 70 9 04 8 5 2 2 2 10 57 9 97 1 1 11 1 15 1 1 12 02 2 5 13 2 269 14 14 4 48 15 5 5 5 6 16 49 9 9 9510 17 125 5 5 5 3 2 18 9 9 987 5 19 5 4 20
Step by Step Solution
There are 3 Steps involved in it

Get step-by-step solutions from verified subject matter experts