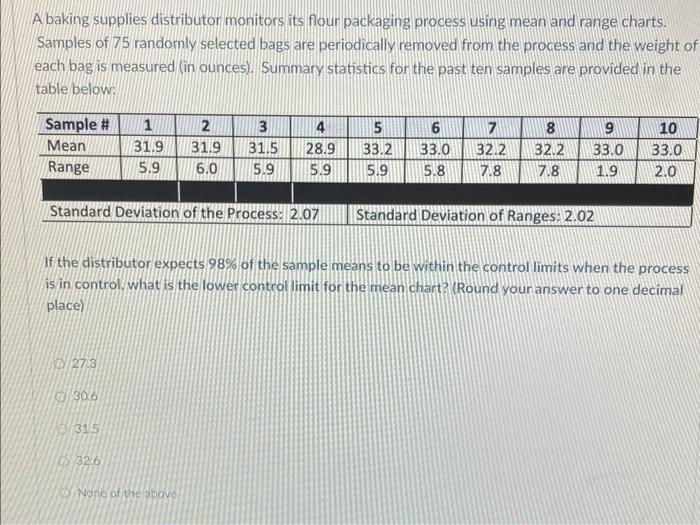
Question: A baking supplies distributor monitors its flour packaging process using mean and range charts. Samples of 75 randomly selected bags are periodically removed from the

A baking supplies distributor monitors its flour
A baking supplies distributor monitors its flour packaging process using mean and range charts. Samples of 75 randomly selected bags are periodically removed from the process and the weight of each bag is measured in ounces). Summary statistics for the past ten samples are provided in the table below: 3 5 9 10 Sample # Mean Range 1 31.9 5.9 2 31.9 6.0 3 31.5 5.9 4 28.9 5.9 33.2 5.9 6 33.0 5.8 32.2 7.8 8 32.2 7.8 33.0 1.9 33.0 2.0 Standard Deviation of the Process: 2.07 Standard Deviation of Ranges: 2.02 If the distributor expects 98% of the sample means to be within the control limits when the process is in control, what is the lower control limit for the mean chart? (Round your answer to one decimal place) 27.3 306 31.5 32,6 None of the above

Step by Step Solution

There are 3 Steps involved in it

1 Expert Approved Answer
Step: 1 Unlock blur-text-image
Question Has Been Solved by an Expert!

Get step-by-step solutions from verified subject matter experts

Step: 2 Unlock
Step: 3 Unlock

Students Have Also Explored These Related General Management Questions!