

Question: A baseball analyst would like to study various team statistics for a recent season to determine which variables might be useful in predicting the number
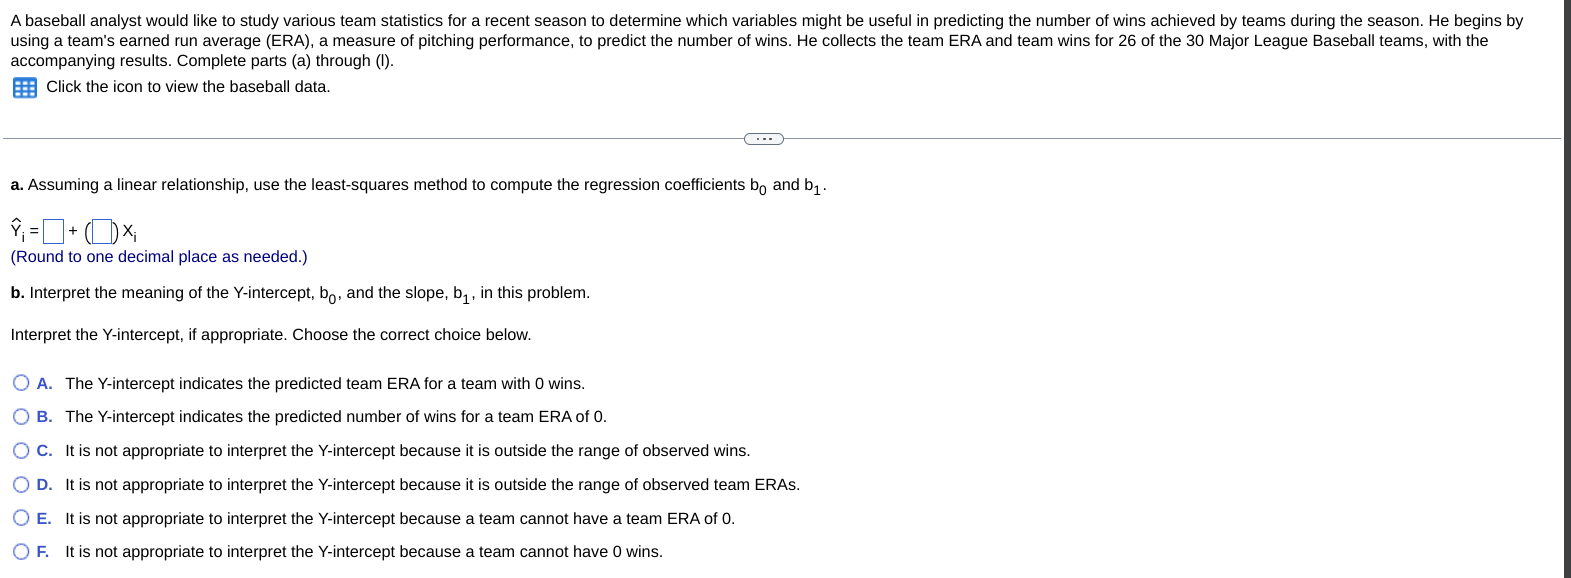
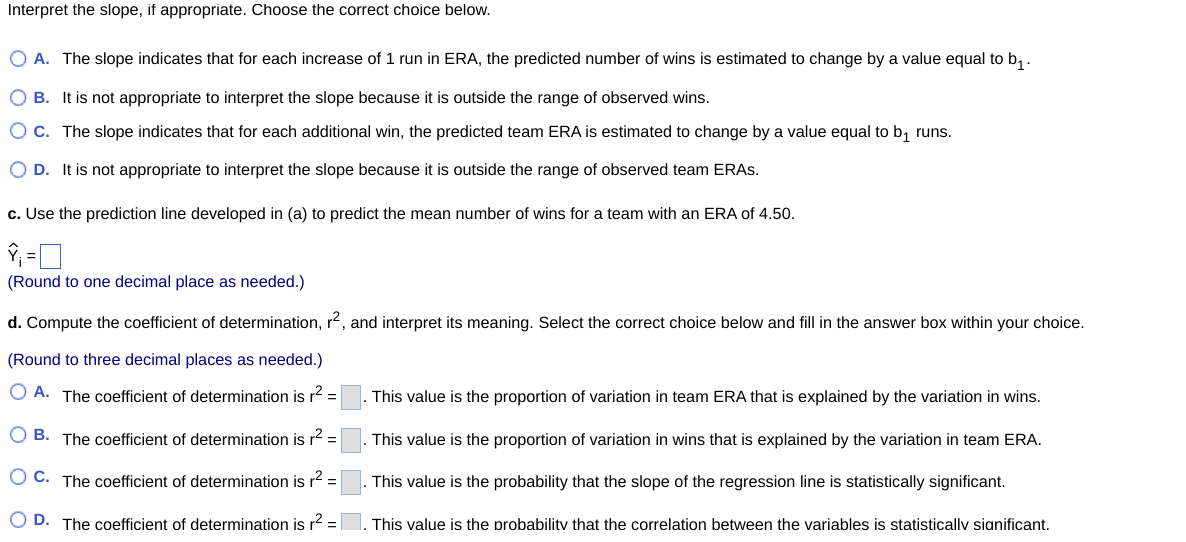
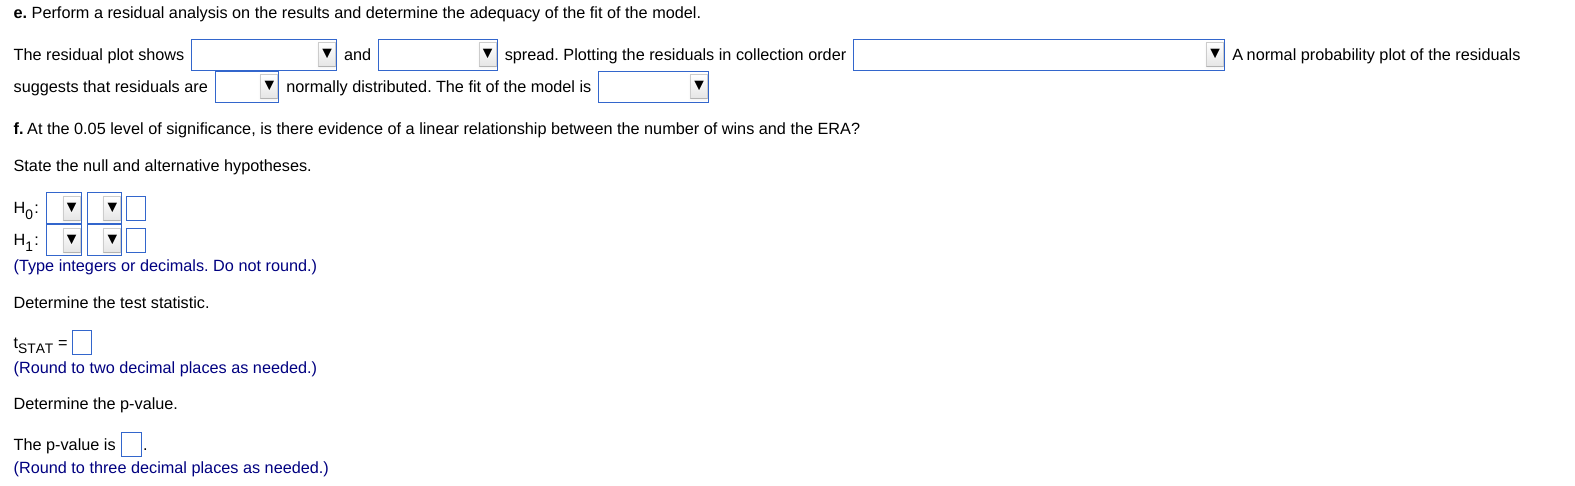
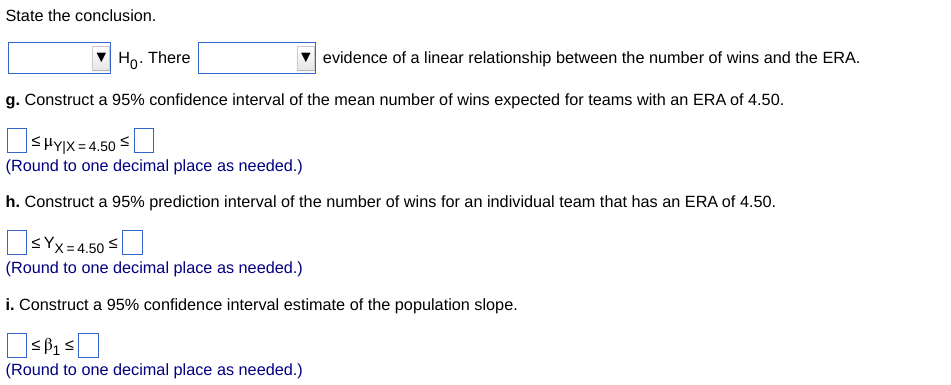
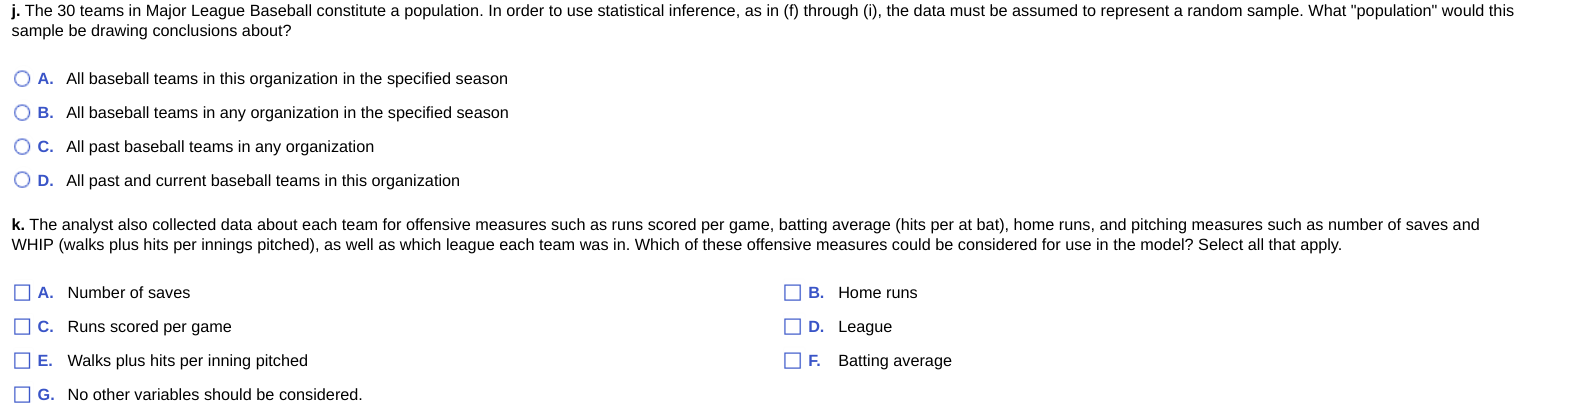
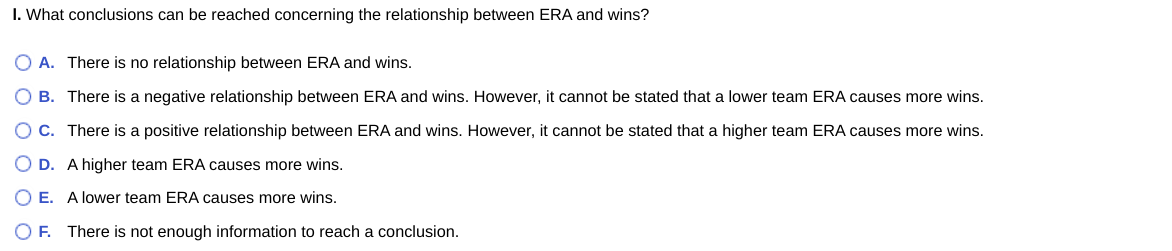
A baseball analyst would like to study various team statistics for a recent season to determine which variables might be useful in predicting the number of wins achieved by teams during the season. He begins by using a team's earned run average (ERA), a measure of pitching performance, to predict the number of wins. He collects the team ERA and team wins for 26 of the 30 Major League Baseball teams, with the accompanying results. Complete parts (a) through (I). EF Click the icon to view the baseball data. a. Assuming a linear relationship, use the least-squares method to compute the regression coefficients by and b, . ?\\ = + ( X (Round to one decimal place as needed.) b. Interpret the meaning of the Y-intercept, by, and the slope, by, in this problem. Interpret the Y-intercept, if appropriate. Choose the correct choice below. ) A. The Y-intercept indicates the predicted team ERA for a team with 0 wins. B. The Y-intercept indicates the predicted number of wins for a team ERA of 0. () C. Itis not appropriate to interpret the Y-intercept hecause it is outside the range of observed wins. D. Itis not appropriate to interpret the Y-intercept because it is outside the range of observed team ERAs. E. Itis not appropriate to interpret the Y-intercept because a team cannot have a team ERA of 0. F. Itis not appropriate to interpret the Y-intercept because a team cannot have 0 wins. Interpret the slope, if appropriate. Choose the correct choice below. () A. The slope indicates that for each increase of 1 run in ERA, the predicted number of wins is estimated to change by a value equal to b,. () B. Itis not appropriate to interpret the slope because it is outside the range of observed wins. (O . The slope indicates that for each additional win, the predicted team ERA is estimated to change by a value equal to b, runs. () D. ltis not appropriate to interpret the slope because it is outside the range of observed team ERAs. c. Use the prediction line developed in (a) to predict the mean number of wins for a team with an ERA of 4.50. ~ Y= (Round to one decimal place as needed.) d. Compute the coefficient of determination, r?, and interpret its meaning. Select the correct choice below and fill in the answer box within your choice. (Round to three decimal places as needed.) O A. The coefficient of determination is r2 =| |. This value is the proportion of variation in team ERA that is explained by the variation in wins. O B. The coefficient of determination is 2 =| |. This value is the proportion of variation in wins that is explained by the variation in team ERA. O C. The coefficient of determination is r2 =| |. This value is the probability that the slope of the regression line is statistically significant. O D. The coefficient of determination is r2 =/ |. This value is the probabilitv that the correlation between the variables is statisticallv sianificant. e. Perform a residual analysis on the results and determine the adequacy of the fit of the model. The residual plot shows | and suggests that residuals are | normally distributed. The fit of the model is v f. At the 0.05 level of significance, is there evidence of a linear relationship between the number of wins and the ERA? v spread. Plotting the residuals in collection order State the null and alternative hypotheses. Hp: v v Hy: v v (Type integers or decimals. Do not round.) Determine the test statistic. tstaT = (Round to two decimal places as needed.) Determine the p-value. The p-value is (Round to three decimal places as needed.) Anormal probability plot of the residuals State the conclusion. |:| Hg. There I:l evidence of a linear relationship between the number of wins and the ERA. g. Construct a 95% confidence interval of the mean number of wins expected for teams with an ERA of 4.50. [ = Hy|x=4.50 = L] (Round to one decimal place as needed.) h. Construct a 95% prediction interval of the number of wins for an individual team that has an ERA of 4.50. DEYx:4_505D (Round to one decimal place as needed.) i. Construct a 95% confidence interval estimate of the population slope. [ |=ps= (Round to one decimal place as needed.) j. The 30 teams in Major League Baseball constitute a population. In order to use statistical inference, as in (f) through (i), the data must be assumed to represent a random sample. What \"population\" would this sample be drawing conclusions about? () A. All baseball teams in this organization in the specified season . All baseball teams in any organization in the specified season . All past baseball teams in any organization . All past and current baseball teams in this organization k. The analyst also collected data about each team for offensive measures such as runs scored per game, batting average (hits per at bat), home runs, and pitching measures such as number of saves and WHIP (walks plus hits per innings pitched), as well as which league each team was in. Which of these offensive measures could be considered for use in the model? Select all that apply. [ ] A. Number of saves [ ] B. Home runs [ . Runs scored per game [1D. League E. Walks plus hits per inning pitched [_] E Batting average [ ] G. No other variables should be considered. I. What conclusions can be reached concerning the relationship between ERA and wins? () A. There is no relationship between ERA and wins. () B. There is a negative relationship between ERA and wins. However, it cannot be stated that a lower team ERA causes more wins. () C. There is a positive relationship between ERA and wins. However, it cannot be stated that a higher team ERA causes more wins. (0 D. Ahigher team ERA causes more wins. () E. Alower team ERA causes more wins. () F. There is not enough information to reach a conclusion
Step by Step Solution
There are 3 Steps involved in it

Get step-by-step solutions from verified subject matter experts