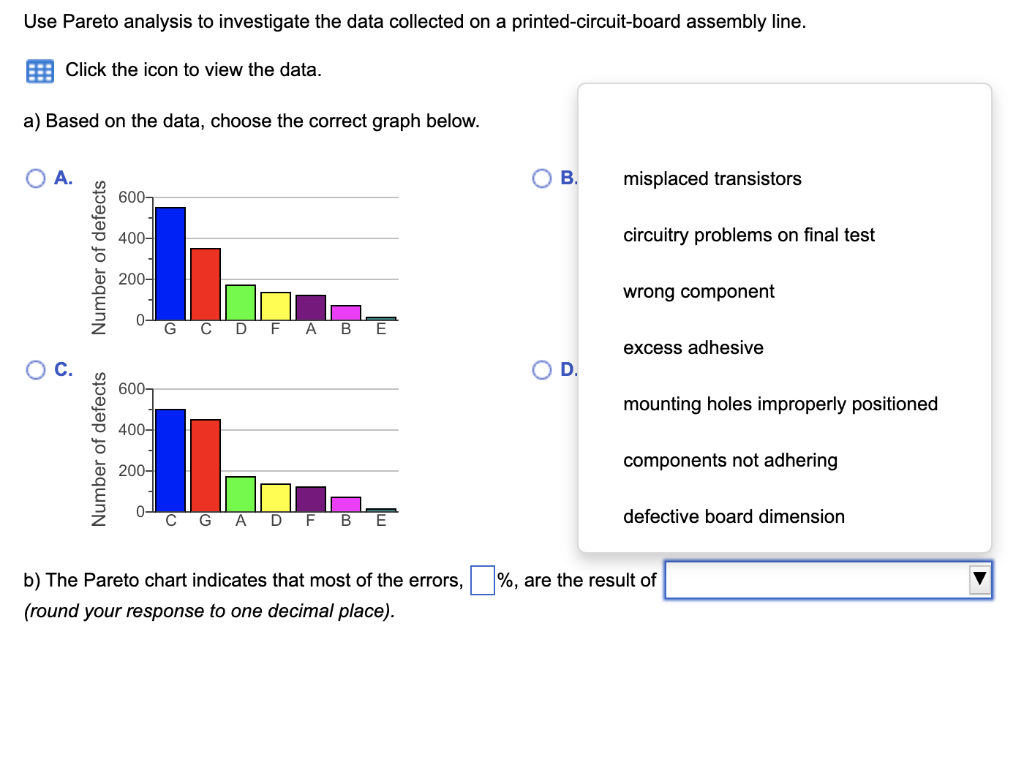
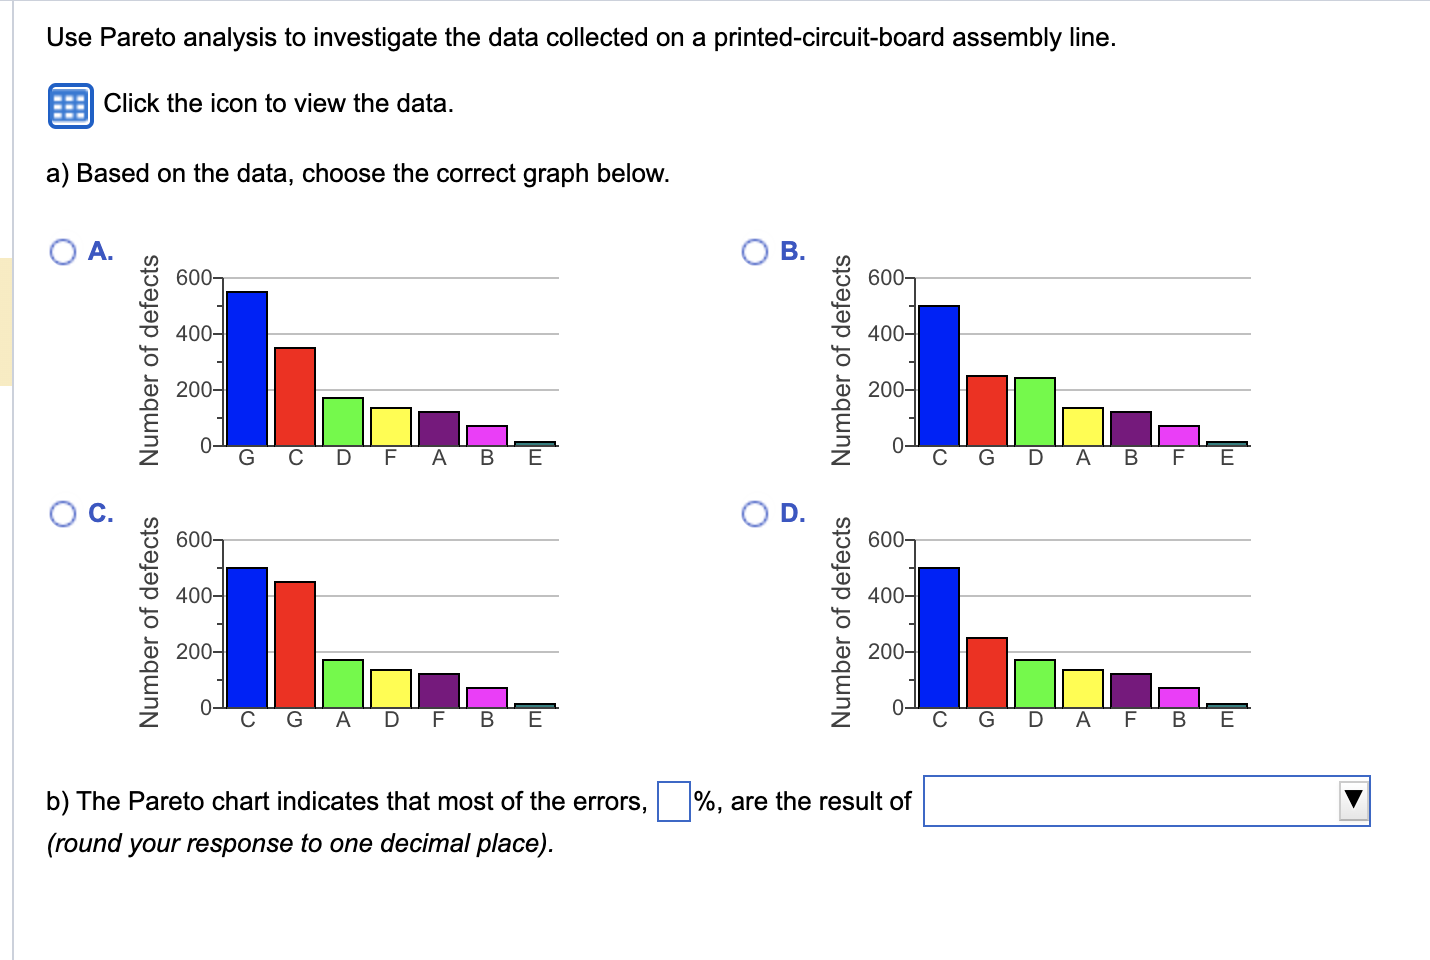
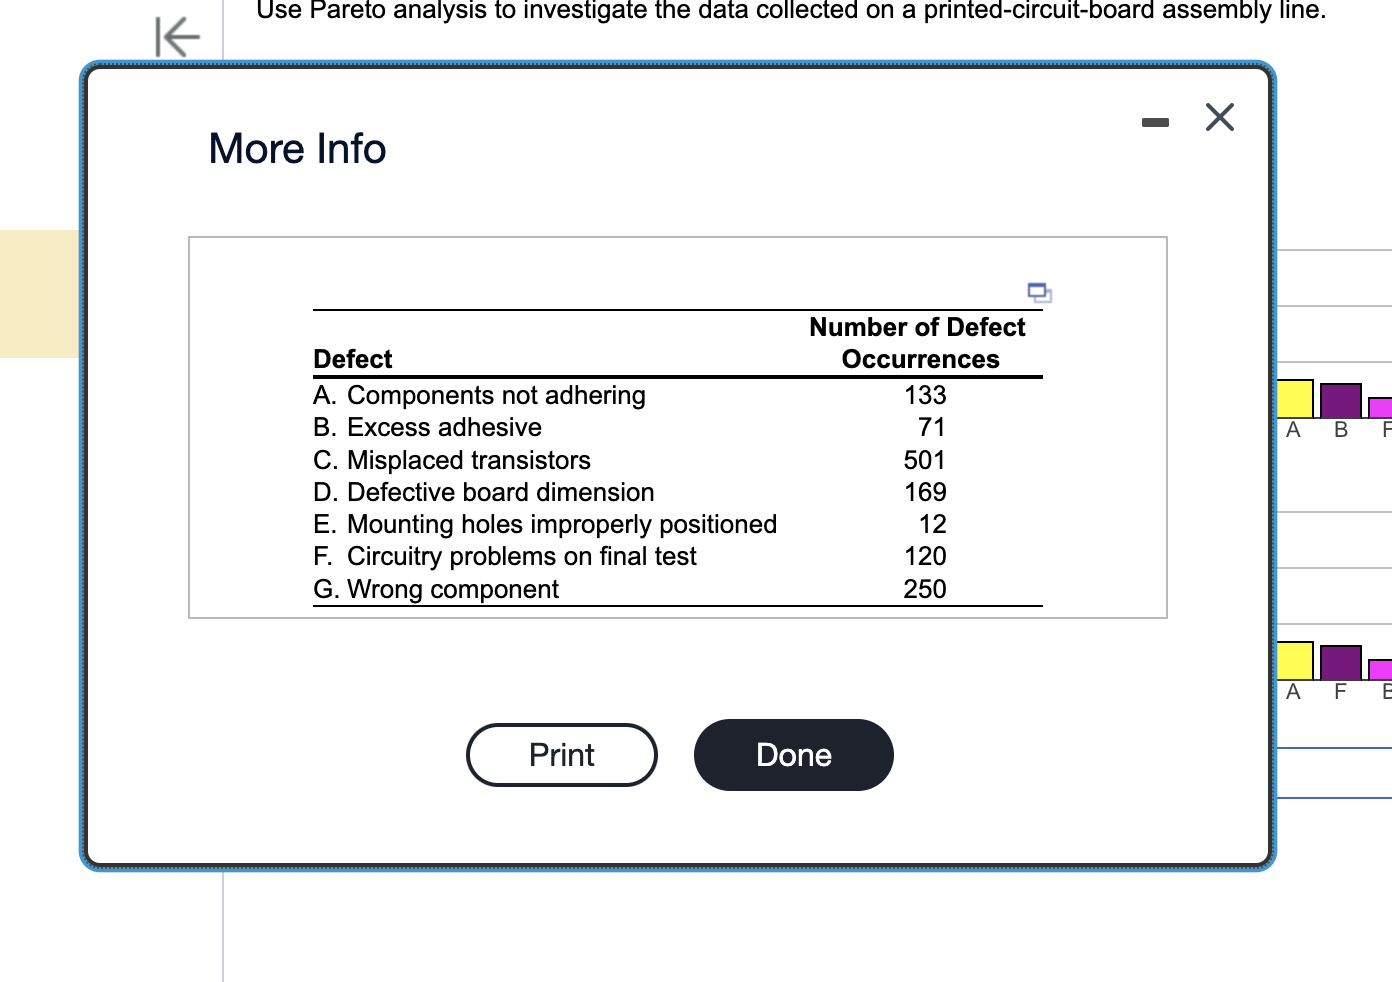
Question: a) Based on the data, choose the correct graph below. A. B. C D. b) The Pareto chart indicates that most of the errors, %,

a) Based on the data, choose the correct grapha) Based on the data, choose the correct grapha) Based on the data, choose the correct graph

a) Based on the data, choose the correct graph below. A. B. C D. b) The Pareto chart indicates that most of the errors, \%, are the result of (round your response to one decimal place). Use Pareto analysis to investigate the data collected on a printed-circuit-board assembly line. Click the icon to view the data. a) Based on the data, choose the correct graph below. A. B. C. D. b) The Pareto chart indicates that most of the errors, %, are the result of (round your response to one decimal place). More Info

Step by Step Solution

There are 3 Steps involved in it

1 Expert Approved Answer
Step: 1 Unlock blur-text-image
Question Has Been Solved by an Expert!

Get step-by-step solutions from verified subject matter experts

Step: 2 Unlock
Step: 3 Unlock

Students Have Also Explored These Related General Management Questions!