

Question: a. Based on the sampling done, the control limits for 3-sigma x overbar x chart are (round all intermediate calculations to three decimal places before
a. Based on the sampling done, the control limits for 3-sigma x overbar x chart are (round all intermediate calculations to three decimal places before proceeding with furthercalculations):
Upper Control Limit(UCL Subscript x overbar UCLx) =
Lower Control Limit(LCL Subscript x overbar LCLx) =
Based on the x overbar x-chart, the wire cutting process has been (In control/out of control)
b. The control limits for the 3-sigma R-chart are (round all intermediate calculations to three decimal places before proceeding with furthercalculations):
Upper Control Limit ( UCL Subscript Upper R UCLR) =
Lower Control Limit ( LCL Subscript Upper R LCLR) =
Based on the R-chart, the wire cutting process has been (IN CONTROL/ Out of control)
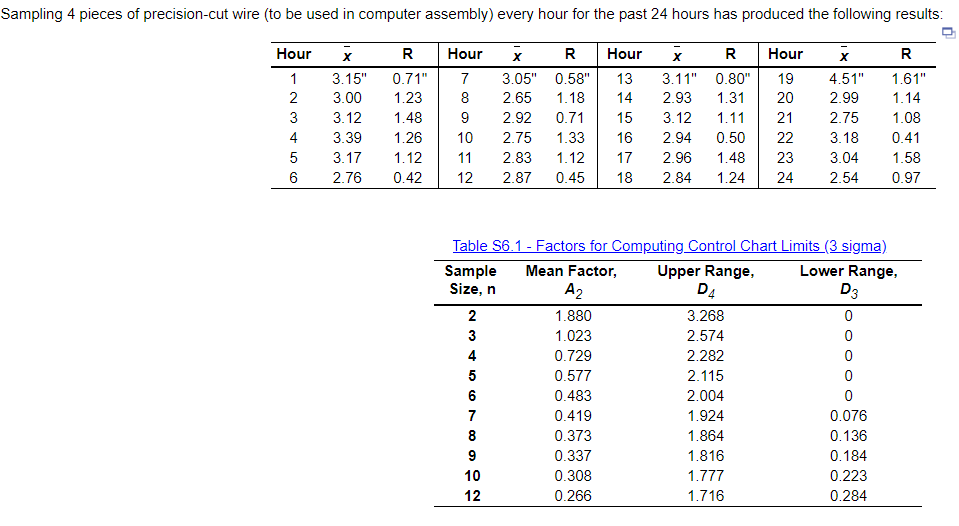
Sampling 4 pieces of precision-cut wire (to be used in computer assembly) every hour for the past 24 hours has produced the following results: Hour Hour Hour R 1 2 3 4 5 6 x 3.15" 3.00 3.12 3.39 3.17 2.76 R 0.71" 1.23 1.48 1.26 1.12 0.42 7 8 9 10 11 12 x 3.05" 2.65 2.92 2.75 2.83 2.87 R 0.58" 1.18 0.71 1.33 1.12 0.45 Hour 13 14 15 16 17 18 x R 3.11" 0.80" 2.93 1.31 3.12 1.11 2.94 0.50 2.96 1.48 2.84 1.24 19 20 21 22 23 24 x 4.51" 2.99 2.75 3.18 3.04 2.54 1.61" 1.14 1.08 0.41 1.58 0.97 D4 D3 Table S6.1 - Factors for Computing Control Chart Limits (3 sigma) Sample Mean Factor, Upper Range, Lower Range, Size, n A2 2 1.880 3.268 0 3 1.023 2.574 0 4 0.729 2.282 0 5 0.577 2.115 0 6 0.483 2.004 0 7 0.419 1.924 0.076 8 0.373 1.864 0.136 9 0.337 1.816 0.184 10 0.308 1.777 0.223 12 0.266 1.716 0.284Step by Step Solution
There are 3 Steps involved in it

Get step-by-step solutions from verified subject matter experts