

Question: A) Based on the sensitivity graph, the analysis is least sensitive to changes in which component? B) The analysis is most sensitive to changes in
A) Based on the sensitivity graph, the analysis is least sensitive to changes in which component? B) The analysis is most sensitive to changes in which component? C) A ____% increase/decrease in initial investment (INIT INV) would make the project unattractive. D) The area above the x-axis represents ________________ projects. E) A ____% increase/decrease in annual revenue (ANN REV) would make the project unattractive. You can use Excel to solve this problem.
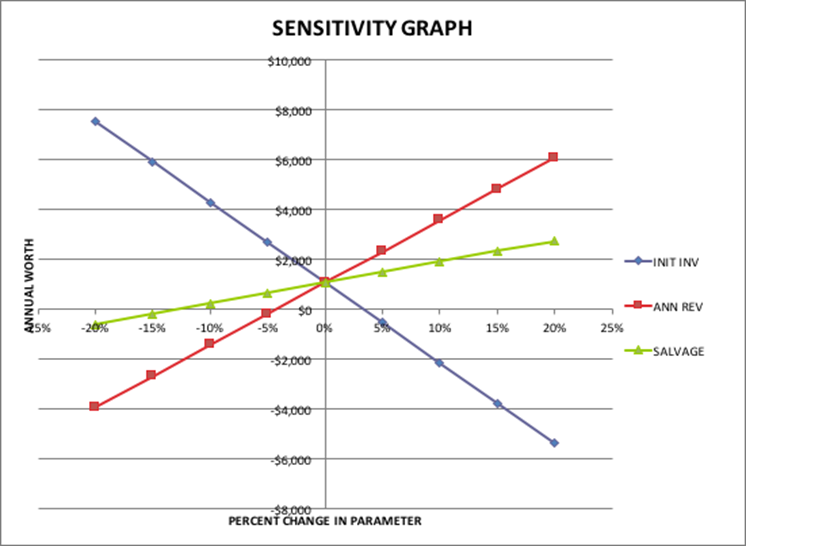
SENSITIVITY GRAPH $8,000 4000 INITINV -a-ANN REV 59% -20R 15% 10% 53% 0 10% 15% 20% 25% SALVAGE S6000 PERCENT CHANGE IN PARAMETER
Step by Step Solution
There are 3 Steps involved in it
1 Expert Approved Answer
Step: 1 Unlock

Question Has Been Solved by an Expert!
Get step-by-step solutions from verified subject matter experts
Step: 2 Unlock
Step: 3 Unlock