

Question: A) Based on the table below, what is the average variable cost of producing 60 Big Macs? Use Figure. TABLE 8.3 Measuring Costs (1) (2)
A)
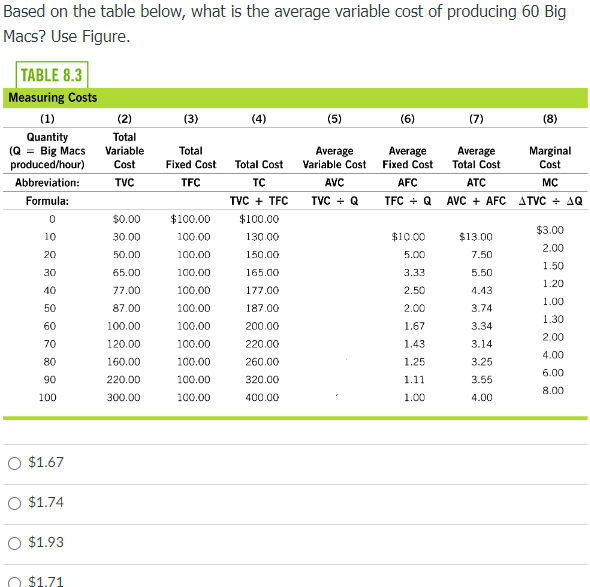
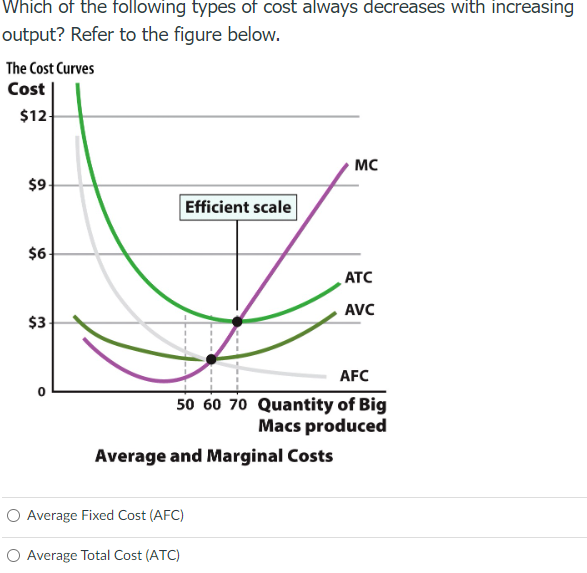

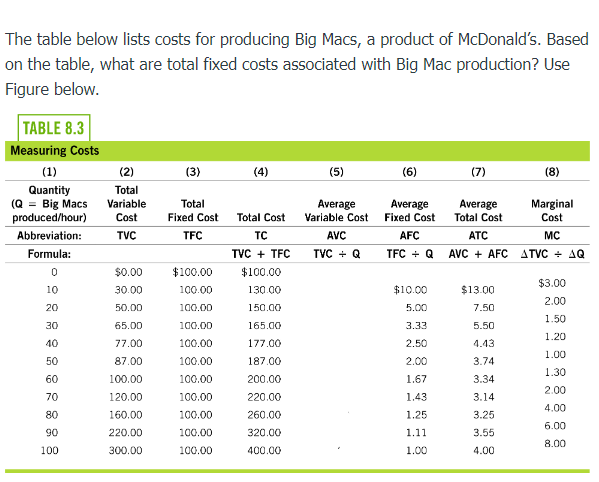

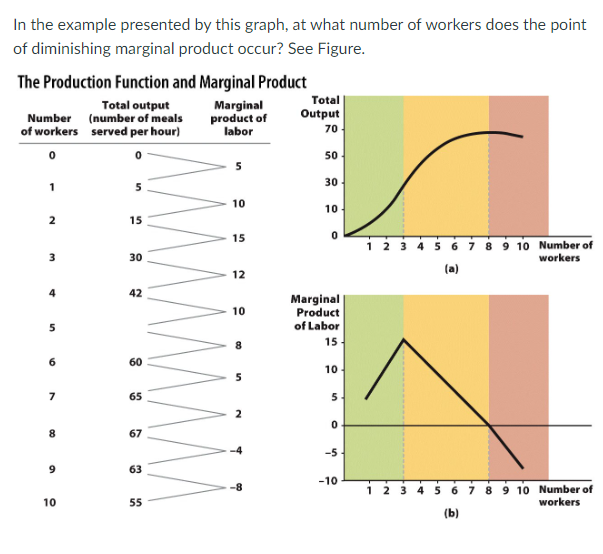

Based on the table below, what is the average variable cost of producing 60 Big Macs? Use Figure. TABLE 8.3 Measuring Costs (1) (2) (3) (4) (5) (6) (7) (8) Quantity Total (Q = Big Macs Variable Total Average Average Average Marginal produced/hour Cost Fixed Cost Total Cost Variable Cost Fixed Cost Total Cost Cost Abbreviation: TVC TFC TC AVC AFC ATC MC Formula: TVC + TFC TVC + Q TFC + Q AVC + AFC ATVC = AQ $0.00 $100.00 $100.00 $3.00 10 30.00 100.00 130.00 $10.00 $13.00 2.00 20 50.00 100.00 150.00 5.00 7.50 1.50 30 65.00 100.00 165.00 3.33 5.50 100.00 177.00 2.50 4.43 1.20 40 77.00 87.00 187.00 3.74 1.00 50 100.00 2.00 1.30 60 100.00 100.00 200.00 1.67 3.34 2.00 70 120.00 100.00 220.00 1.43 3.14 4,00 80 160.00 100.00 260.00 1.25 3.25 6.00 90 220.00 100.00 320.00 1.11 3.55 8.00 100 300.00 100.00 400.00 1.00 4.00 O $1.67 O $1.74 O $1.93 $1.71Which of the following types of cost always decreases with increasing output? Refer to the figure below. The Cost Curves Cost $12- MC $9 Efficient scale $6- ATC AVC $3 AFC 50 60 70 Quantity of Big Macs produced Average and Marginal Costs O Average Fixed Cost (AFC) O Average Total Cost (ATC)\fThe table below lists costs for producing Big Macs, a product of Mcdonald's. Based on the table, what are total fixed costs associated with Big Mac production? Use Figure below. TABLE 8.3 Measuring Costs (1) (2) (3) (4) (5) (6) (7) (8) Quantity Total (Q = Big Macs Variable Total Average Average Average Marginal produced/hour) Cost Fixed Cost Total Cost Variable Cost Fixed Cost Total Cost Cost Abbreviation: TVC TFC TC AVC AFC ATC MC Formula: TVC + TFC TVC + Q TFC + Q AVC + AFC ATVC + AQ $0.00 $100.00 $100.00 10 30.00 100.00 130.00 $10.00 $13.00 $3.00 20 50.00 100.00 150.00 5.00 2.00 7.50 DE 65.00 100.00 165.00 EE'E 1.50 5.50 40 77.00 100.00 177.00 2.50 1.20 4.43 50 87.00 100.00 187.00 2.00 1.00 3.74 60 100.00 100.00 200.00 1.67 1.30 3.34 70 120,00 100.00 220.00 1.43 3.14 2.00 80 160.00 100.00 260.00 1.25 3.25 4.00 90 220.00 100.00 320.00 1.11 3.55 6.00 100 300.00 100.00 400.00 1.00 4.00 8.00\fIn the example presented by this graph, at what number of workers does the point of diminishing marginal product occur? See Figure. The Production Function and Marginal Product Total output Marginal Total Number (number of meals product of Output of workers served per hour] labor 70 0 50 in 30 10 10 2 15 15 1 2 3 4 5 6 7 8 9 10 Number of 30 workers 12 (a) 42 Marginal 10 Product of Labor 8 15 60 10 un 65 5 2 67 -5 63 -10 1 2 3 4 5 6 7 8 9 10 Number of 10 55 workers (b)O 9th worker O 2nd worker O 4th worker O 3rd worker
Step by Step Solution
There are 3 Steps involved in it

Get step-by-step solutions from verified subject matter experts