

Question: A) Based on X bar chart, is one or more samples beyond the control limit? Yes or No B) Based on R-chart, is one or
A) Based on X bar chart, is one or more samples beyond the control limit? Yes or No
B) Based on R-chart, is one or more sample beyond the control limit? Yes or No
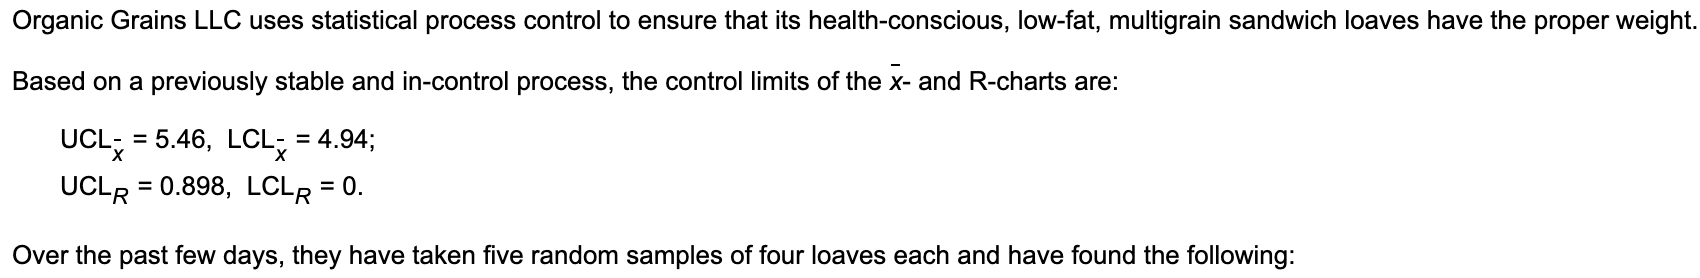
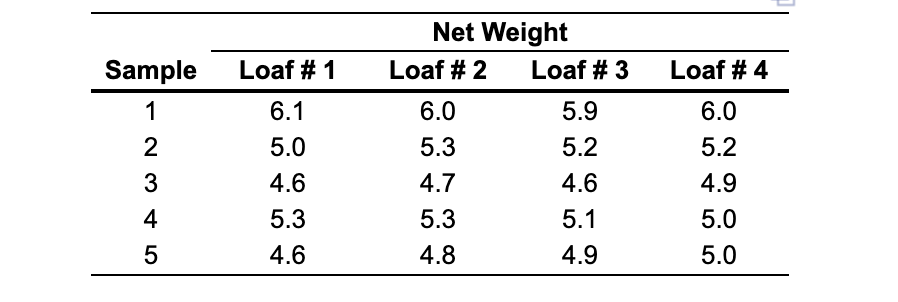
Organic Grains LLC uses statistical process control to ensure that its health-conscious, low-fat, multigrain sandwich loaves have the proper weight. Based on a previously stable and in-control process, the control limits of the x- and R-charts are: UCL = 5.46, LCLx = 4.94; UCLR = 0.898, LCLR = 0. Over the past few days, they have taken five random samples of four loaves each and have found the following: Sample Loaf # 1 1 2345 6.1 5.0 4.6 5.3 4.6 Net Weight Loaf # 2 6.0 5.3 4.7 5.3 4.8 Loaf # 3 5.9 5.2 4.6 5.1 4.9 Loaf # 4 6.0 5.2 4.9 5.0 5.0Step by Step Solution
There are 3 Steps involved in it
1 Expert Approved Answer
Step: 1 Unlock

Question Has Been Solved by an Expert!
Get step-by-step solutions from verified subject matter experts
Step: 2 Unlock
Step: 3 Unlock