

Question: A beam is shown in the figure below. ( Figure 1 ) Figure 1 of 1 A horizontal beam is supported by a pin at
A beam is shown in the figure below. Figure
Figure of
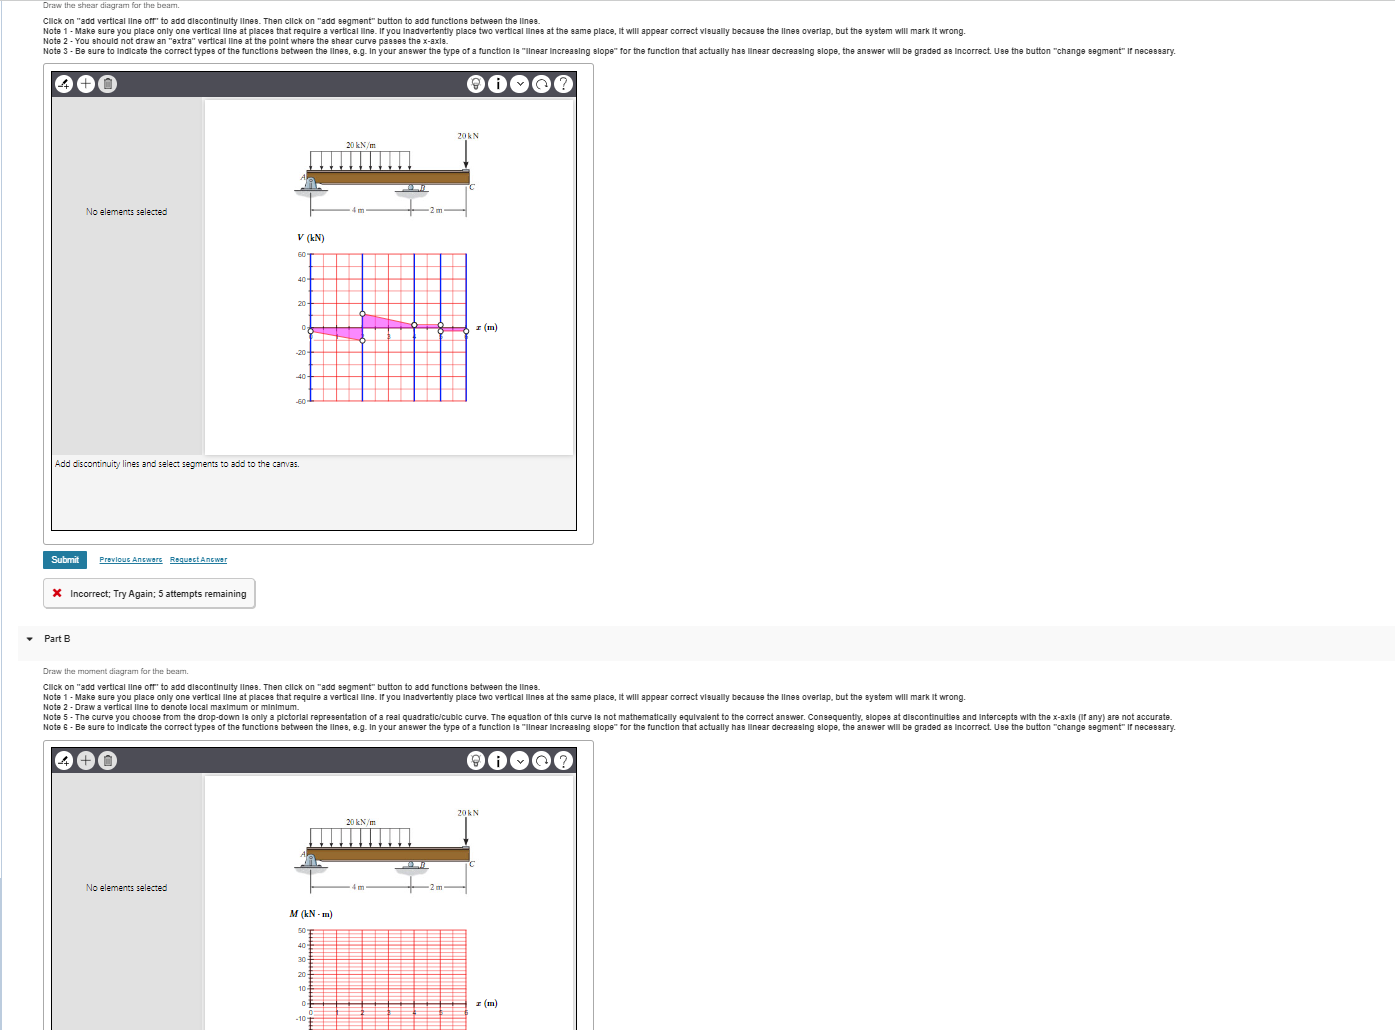
A horizontal beam is supported by a pin at its left end A and supported by a roller at point B on the beam. The free right end of the beam is marked as C Point B is meters to the left of end C and meters to the right of end A Both the pin and the roller are mounted on a horizontal surface. A distributed load of kilonewtons per meter acts vertically downward on segment A B of the beam. A point load of kilonewtons acts vertically downward on end C of the beam.
Part A
Draw the shear diagram for the beam.
Click on "add vertical line off" to add discontinuity lines. Then click on "add segment" button to add functions between the lines.
Note Make sure you place only one vertical line at places that require a vertical line. If you inadvertently place two vertical lines at the same place, it will appear correct visually because the lines overlap, but the system will mark it wrong.
Note You should not draw an "extra" vertical line at the point where the shear curve passes the xaxis.
Note Be sure to indicate the correct types of the functions between the lines, eg in your answer the type of a function is "linear increasing slope" for the function that actually has linear decreasing slope, the answer will be graded as incorrect. Use the button "change segment" if necessary.
No elements selected
A horizontal beam is supported by a pin at its left end A and supported by a roller at point B on the beam. The free right end of the beam is marked as C Point B is meters to the left of end C and meters to the right of end A Both the pin and the roller are mounted on a horizontal surface. A distributed load of kilonewtons per meter acts vertically downward on segment A B of the beam. A point load of kilonewtons acts vertically downward on end C of the beam. Distance x is measured horizontally rightward from the left end of the beam.
xm
VkN
Add discontinuity lines and select segments to add to the canvas.
Previous AnswersRequest Answer
Incorrect; Try Again; attempts remaining
Part B
Draw the moment diagram for the beam.
Click on "add vertical line off" to add discontinuity lines. Then click on "add segment" button to add functions between the lines.
Note Make sure you place only one vertical line at places that require a vertical line. If you inadvertently place two vertical lines at the same place, it will appear correct visually because the lines overlap, but the system will mark it wrong.
Note Draw a vertical line to denote local maximum or minimum.
Note The curve you choose from the dropdown is only a pictorial representation of a real quadraticcubic curve. The equation of this curve is not mathematically equivalent to the correct answer. Consequently, slopes at discontinuities and intercepts with the xaxis if any are not accurate.
Note Be sure to indicate the correct types of the functions between the lines, eg in your answer the type of a function is "linear increasing slope" for the function that actually has linear decreasing slope, the answer will be graded as incorrect. Use the button "change segment" if necessary.
Step by Step Solution
There are 3 Steps involved in it
1 Expert Approved Answer
Step: 1 Unlock

Question Has Been Solved by an Expert!
Get step-by-step solutions from verified subject matter experts
Step: 2 Unlock
Step: 3 Unlock