

Question: a. Below is a fault tree corresponding to the Reliability Block Diagram (RBD). (3 marks). Figure 1: System Reliability Block Diagram (2020) courtesy of the
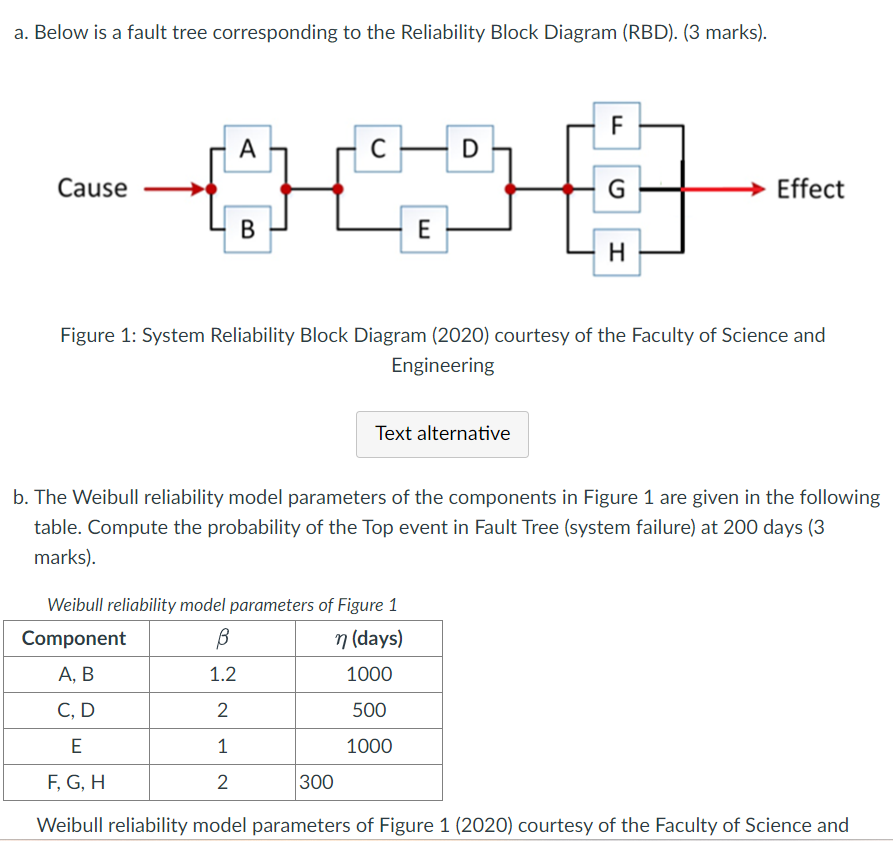
a. Below is a fault tree corresponding to the Reliability Block Diagram (RBD). (3 marks). Figure 1: System Reliability Block Diagram (2020) courtesy of the Faculty of Science and Engineering b. The Weibull reliability model parameters of the components in Figure 1 are given in the following table. Compute the probability of the Top event in Fault Tree (system failure) at 200 days (3 marks). Weibull reliability model parameters of Figure 1
Step by Step Solution
There are 3 Steps involved in it
1 Expert Approved Answer
Step: 1 Unlock

Question Has Been Solved by an Expert!
Get step-by-step solutions from verified subject matter experts
Step: 2 Unlock
Step: 3 Unlock