Question: A. Binomial variance and s.d.. 1. For this question let p = X, where X is a Binomial(n,p) random variable the number of successes in
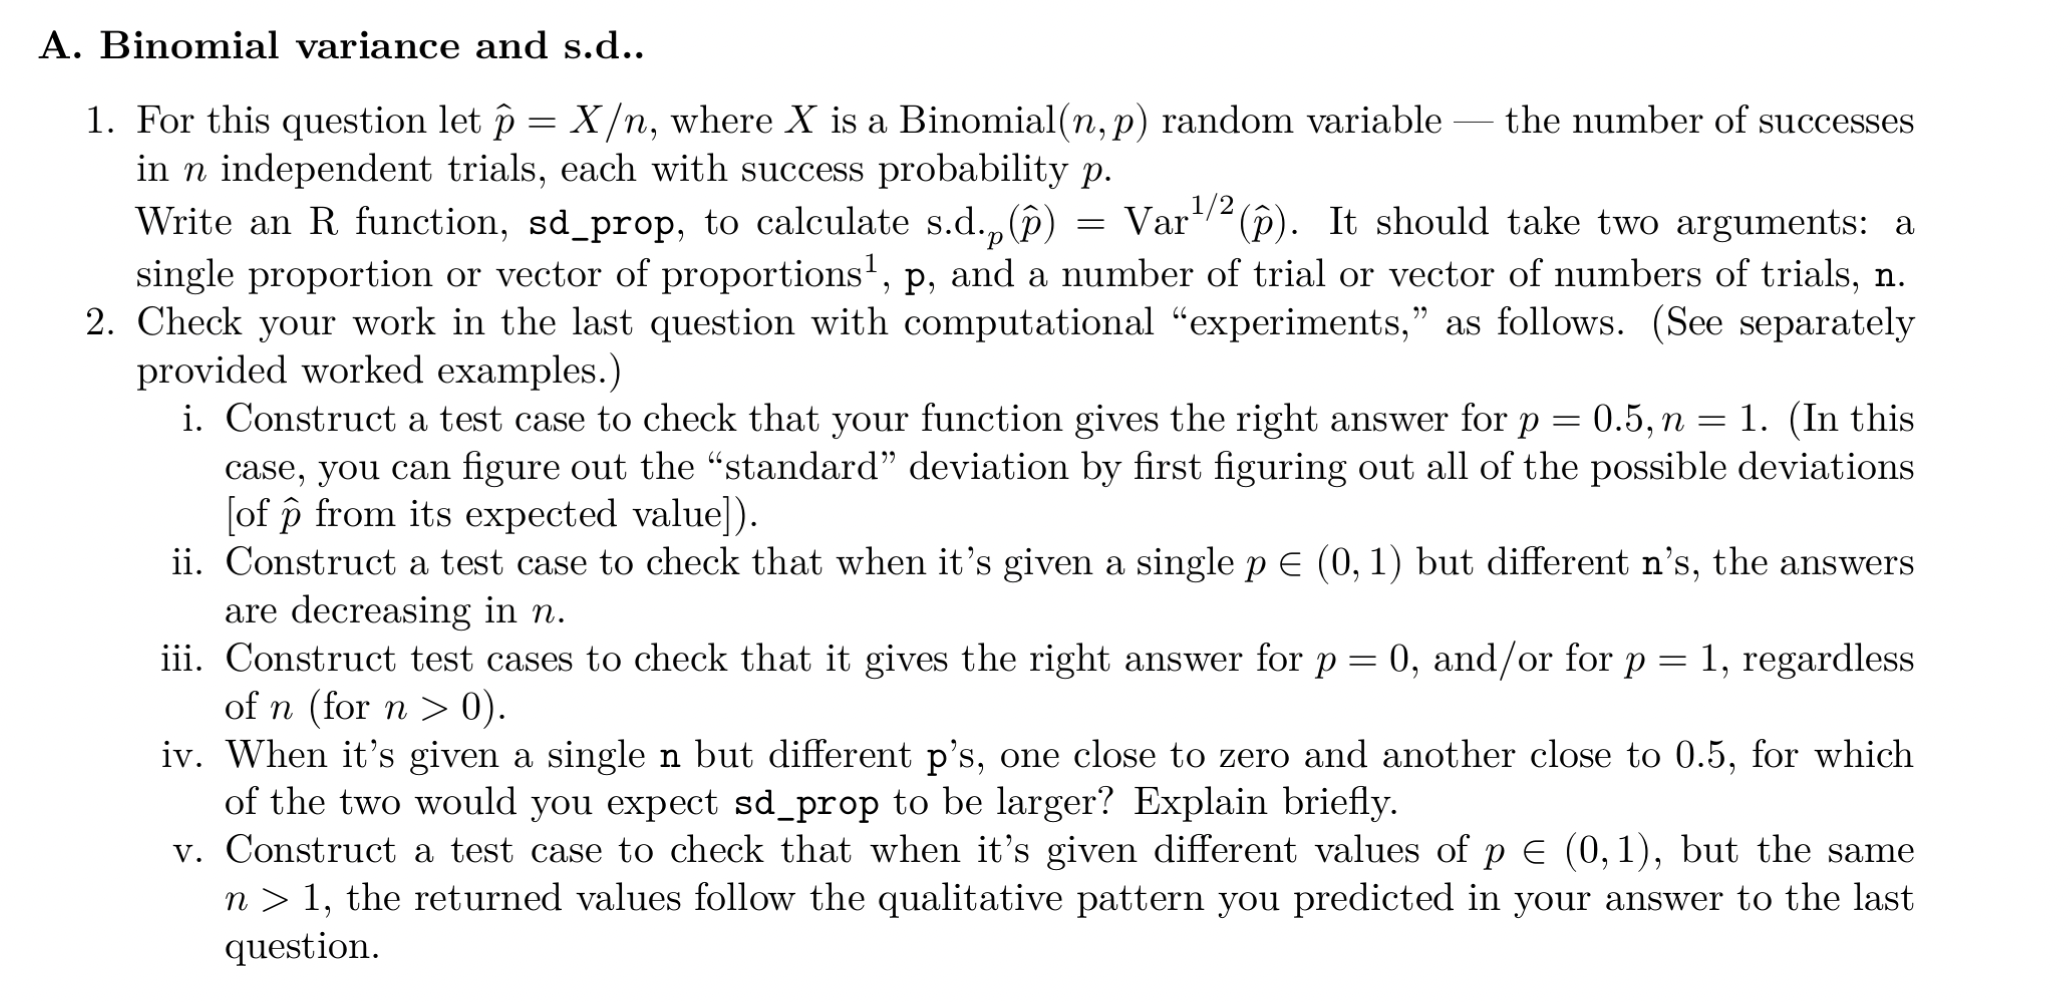
A. Binomial variance and s.d.. 1. For this question let p = X, where X is a Binomial(n,p) random variable the number of successes in n independent trials, each with success probability p. Write an R function, sd_prop, to calculate s.d., Cn) = Var2 (). It should take two arguments: a single proportion or vector of proportions?, p, and a number of trial or vector of numbers of trials, n. 2. Check your work in the last question with computational experiments, as follows. (See separately provided worked examples.) i. Construct a test case to check that your function gives the right answer for 0.5, n = 1. (In this case, you can figure out the standard deviation by first figuring out all of the possible deviations [of p from its expected value]). ii. Construct a test case to check that when it's given a single p E (0,1) but different n's, the answers are decreasing in n. iii. Construct test cases to check that it gives the right answer for p 0, and/or for p = 1, regardless of n (for n > 0). iv. When it's given a single n but different ps, one close to zero and another close to 0.5, for which of the two would you expect sd_prop to be larger? Explain briefly. v. Construct a test case to check that when it's given different values of p E (0,1), but the same n> 1, the returned values follow the qualitative pattern you predicted in your answer to the last question. = A. Binomial variance and s.d.. 1. For this question let p = X, where X is a Binomial(n,p) random variable the number of successes in n independent trials, each with success probability p. Write an R function, sd_prop, to calculate s.d., Cn) = Var2 (). It should take two arguments: a single proportion or vector of proportions?, p, and a number of trial or vector of numbers of trials, n. 2. Check your work in the last question with computational experiments, as follows. (See separately provided worked examples.) i. Construct a test case to check that your function gives the right answer for 0.5, n = 1. (In this case, you can figure out the standard deviation by first figuring out all of the possible deviations [of p from its expected value]). ii. Construct a test case to check that when it's given a single p E (0,1) but different n's, the answers are decreasing in n. iii. Construct test cases to check that it gives the right answer for p 0, and/or for p = 1, regardless of n (for n > 0). iv. When it's given a single n but different ps, one close to zero and another close to 0.5, for which of the two would you expect sd_prop to be larger? Explain briefly. v. Construct a test case to check that when it's given different values of p E (0,1), but the same n> 1, the returned values follow the qualitative pattern you predicted in your answer to the last question. =


