

Question: A biologist is interested in assessing how temperature affects fish growth. Which data (represented by graphs A, B and C) are (you can choose one,
A biologist is interested in assessing how temperature affects fish growth. Which data (represented by graphs A, B and C) are (you can choose one, two or all data sets) seem to be the most appropriate for conducting an ANOVA? Explain in details your choices.
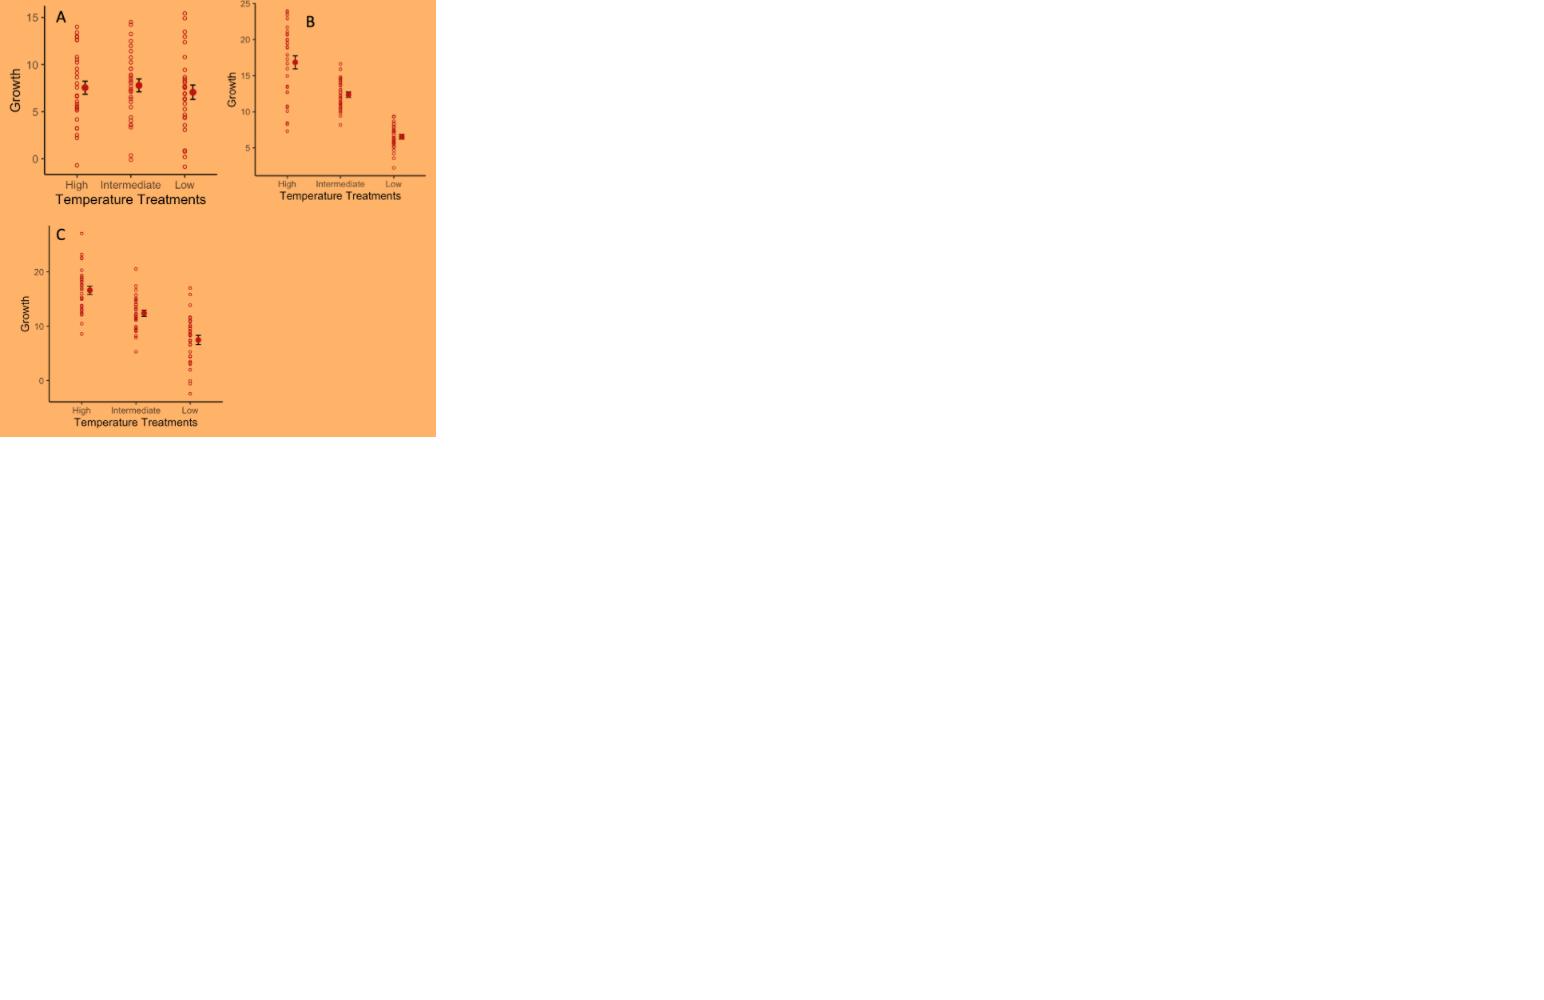
0 20- High Intermediate Low Temperature Treatments C High Intermediate Low Temperature Treatments 20 5 B High Intermediate Low Temperature Treatments
Step by Step Solution
3.55 Rating (148 Votes )
There are 3 Steps involved in it
To carry out an ANOVA test the variable of study must be quantitative continuous And the classificat... View full answer

Get step-by-step solutions from verified subject matter experts