

Question: A boxplot for a sample data is shown below. There are no outliers. -6 16 36 H6 1'98 lCl:ll 4 l l I I I
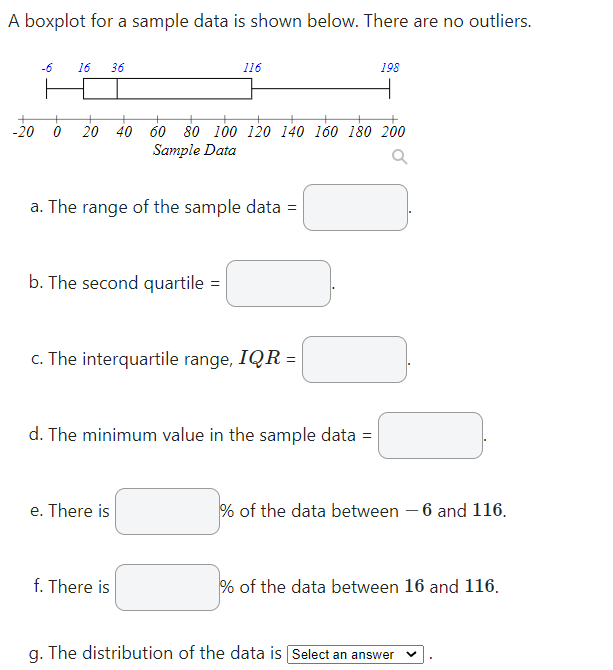
A boxplot for a sample data is shown below. There are no outliers. -6 16 36 H6 1'98 lCl:ll 4 l l I I I I l I I I I 2r5' E} 20 40 60 80 100 .320 140 160 180 200 Sampfe Data Q a. The range of the sample data = C]. b. The second quartile = C]. C. The interquartile range, IQR : C]. d. The minimum value in the sample data = C]. C196 of the data between 6 and 116. g. The distribution of the data is . e. There is f. There is of the data between 16 and 116
Step by Step Solution
There are 3 Steps involved in it
1 Expert Approved Answer
Step: 1 Unlock

Question Has Been Solved by an Expert!
Get step-by-step solutions from verified subject matter experts
Step: 2 Unlock
Step: 3 Unlock