

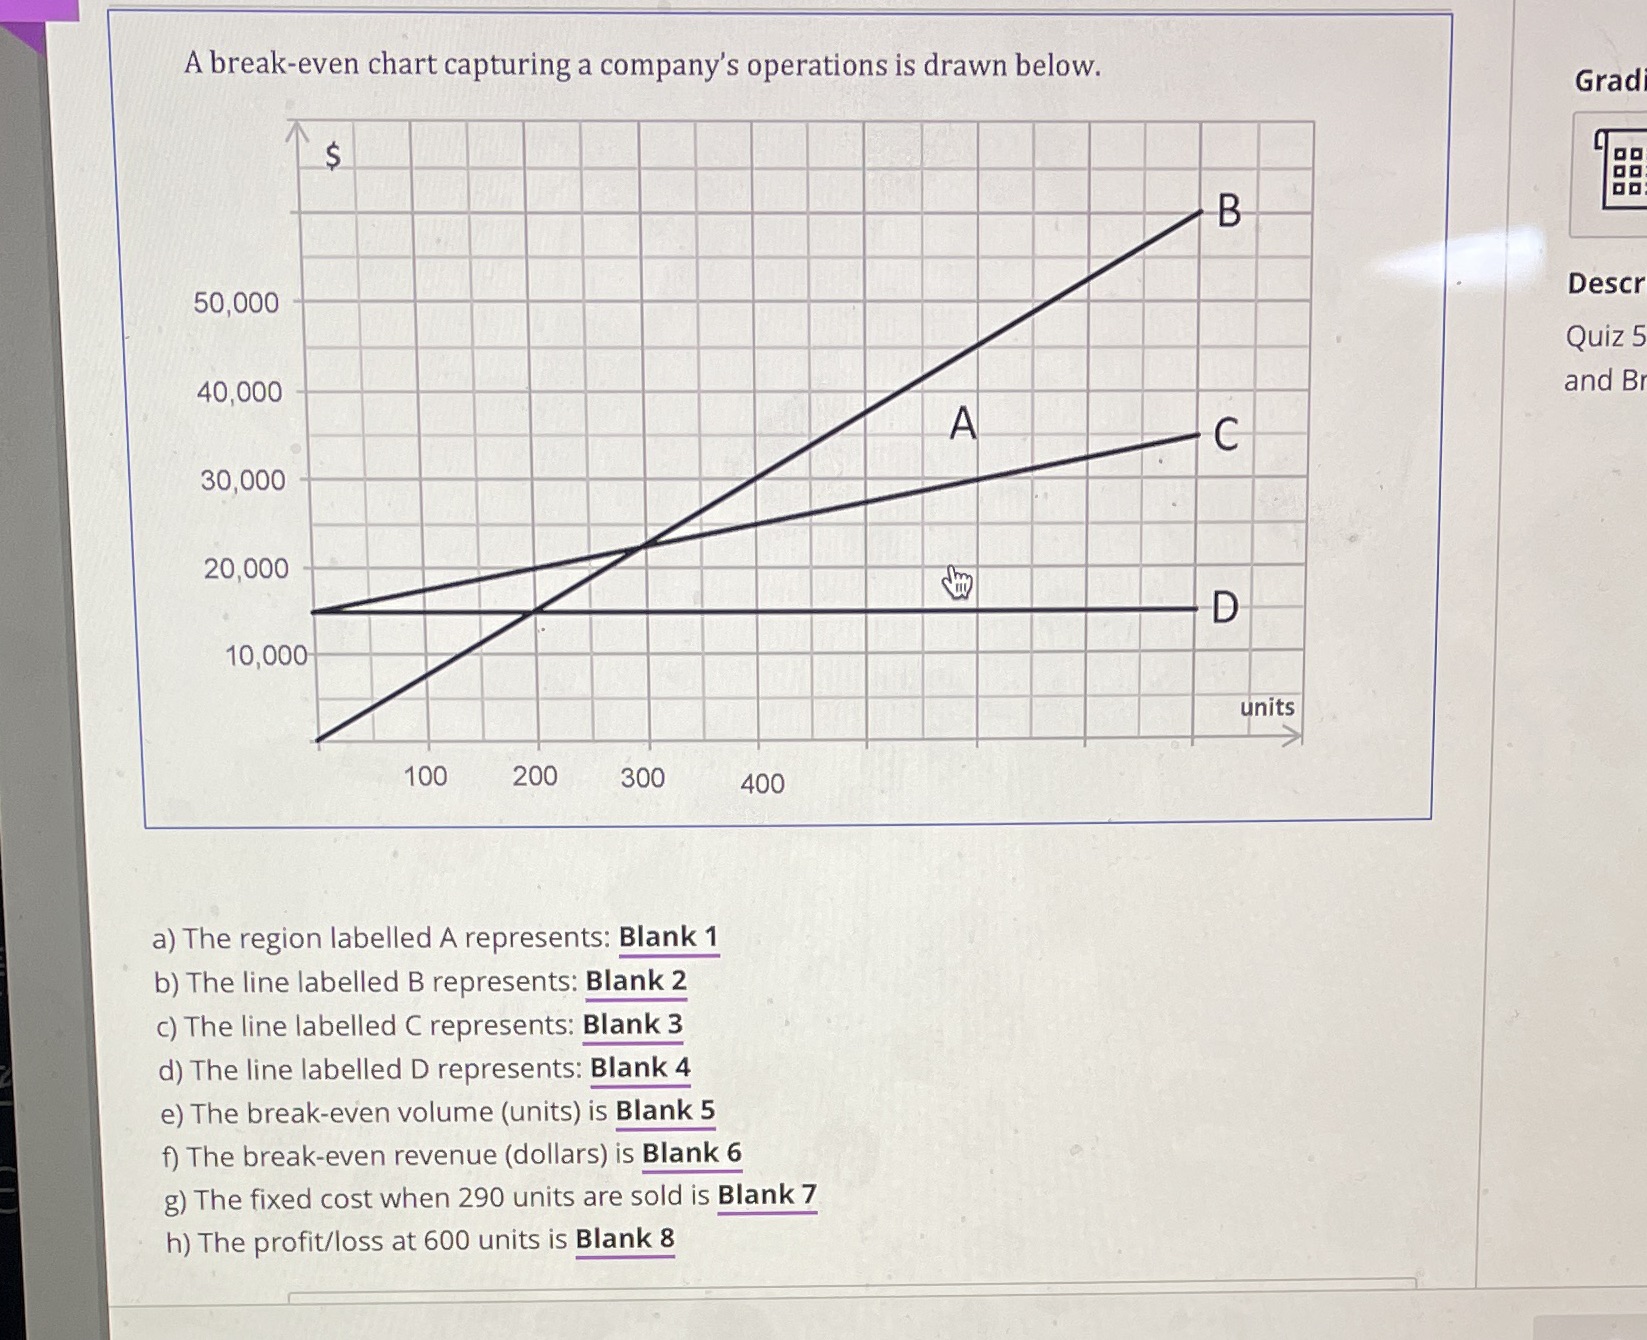
Question: A break-even chart capturing a company's operations is drawn below. Grad $ B 50,000 Descr Quiz 5 40,000 and B A C 30,000 20,000 D
Step by Step Solution
There are 3 Steps involved in it
1 Expert Approved Answer
Step: 1 Unlock

Question Has Been Solved by an Expert!
Get step-by-step solutions from verified subject matter experts
Step: 2 Unlock
Step: 3 Unlock