

Question: a) Briefly comment on the output above. Does the regression as a whole seem to be a doing a good job? You must justify your
a) Briefly comment on the output above. Does the regression as a whole seem to be a doing a good job? You must justify your answer using the values of goodness of fitness measures in the table above.
b) Using the attached Students t distribution table, construct a 95% confidence interval for the
coefficient of deltaGDP using the output above.
c) Using coefficient estimates above, determine the predicted UK20yrt value in a quarter for
which the variable realisations are as follows:
UK3mt = 0.5
US3mt = 0.6
UK6mt = 0.8
GBPUSDt = 1.25
deltaGDPt = 0.0
d) Now suppose that a researcher wanting to see if the model above can be made simpler drops both of the 3-month interest rate variables from the model and reruns the shorter version using the same dataset. The residual sum of squares (RSS) from the smaller model turns out to be 2.674. Using this RSS value and the RSS from the larger model above, calculate the F- statistic. Determine, using the attached F distribution table, whether the researcher should stick to the longer model or switch to the shorter one. Use a level of significance of 5%.
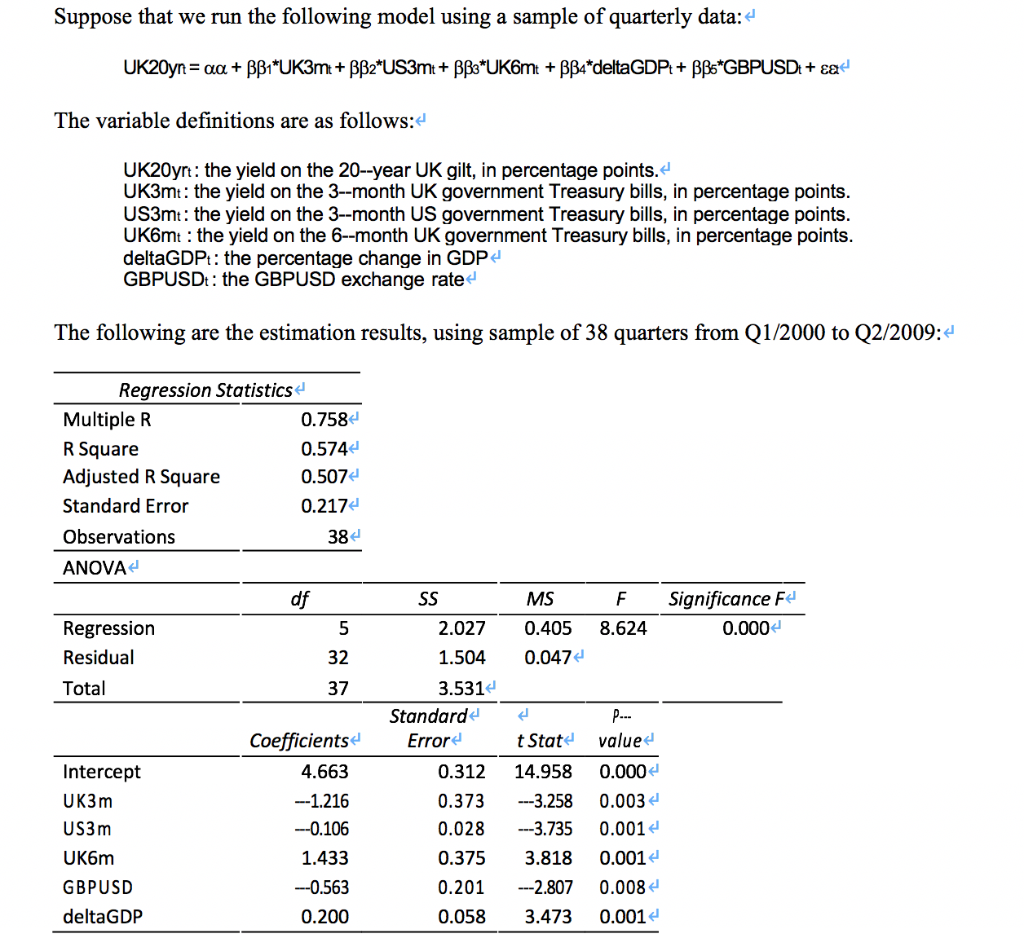
Suppose that we run the following model using a sample of quarterly data:4 The variable definitions are as follows: UK20yrt: the yield on the 20--year UK gilt, in percentage points. UK3mt: the yield on the 3--month UK government Treasury bills, in percentage points US3mt: the yield on the 3--month US government Treasury bills, in percentage points UK6mt : the yield on the 6--month UK government Treasury bills, in percentage points deltaGDPt: the percentage change in GDP GBPUSDt: the GBPUSD exchange rate The following are the estimation results, using sample of 38 quarters from Q1/2000 to Q2/2009: Regression Statistics Multiple P R Square Adjusted R Square Standard Error Observations ANOVA 0.758 0.574e 0.507 0.217 38 df FSignificance Fe MS Regressioin Residual Total 2.027 0.405 8.624 1.504 0.047 3.531 0.000 32 37 Standard Coefficients Errord t State value 0.312 14.958 0.000 3.258 0.003 3.735 0.001 0.375 3.818 0.001 2.807 0.008 0.058 3.473 0.001 4.663 --1.216 -0.106 1.433 -0.563 0.200 Intercept UK3m US3m UK6m GBPUSD deltaGDP 0.373 0.028 0.201 Suppose that we run the following model using a sample of quarterly data:4 The variable definitions are as follows: UK20yrt: the yield on the 20--year UK gilt, in percentage points. UK3mt: the yield on the 3--month UK government Treasury bills, in percentage points US3mt: the yield on the 3--month US government Treasury bills, in percentage points UK6mt : the yield on the 6--month UK government Treasury bills, in percentage points deltaGDPt: the percentage change in GDP GBPUSDt: the GBPUSD exchange rate The following are the estimation results, using sample of 38 quarters from Q1/2000 to Q2/2009: Regression Statistics Multiple P R Square Adjusted R Square Standard Error Observations ANOVA 0.758 0.574e 0.507 0.217 38 df FSignificance Fe MS Regressioin Residual Total 2.027 0.405 8.624 1.504 0.047 3.531 0.000 32 37 Standard Coefficients Errord t State value 0.312 14.958 0.000 3.258 0.003 3.735 0.001 0.375 3.818 0.001 2.807 0.008 0.058 3.473 0.001 4.663 --1.216 -0.106 1.433 -0.563 0.200 Intercept UK3m US3m UK6m GBPUSD deltaGDP 0.373 0.028 0.201
Step by Step Solution
There are 3 Steps involved in it

Get step-by-step solutions from verified subject matter experts