

Question: A brochure claims that the average maximum height a certain type of plant is 0.7 m. A gardener suspects that this estimate is not accurate
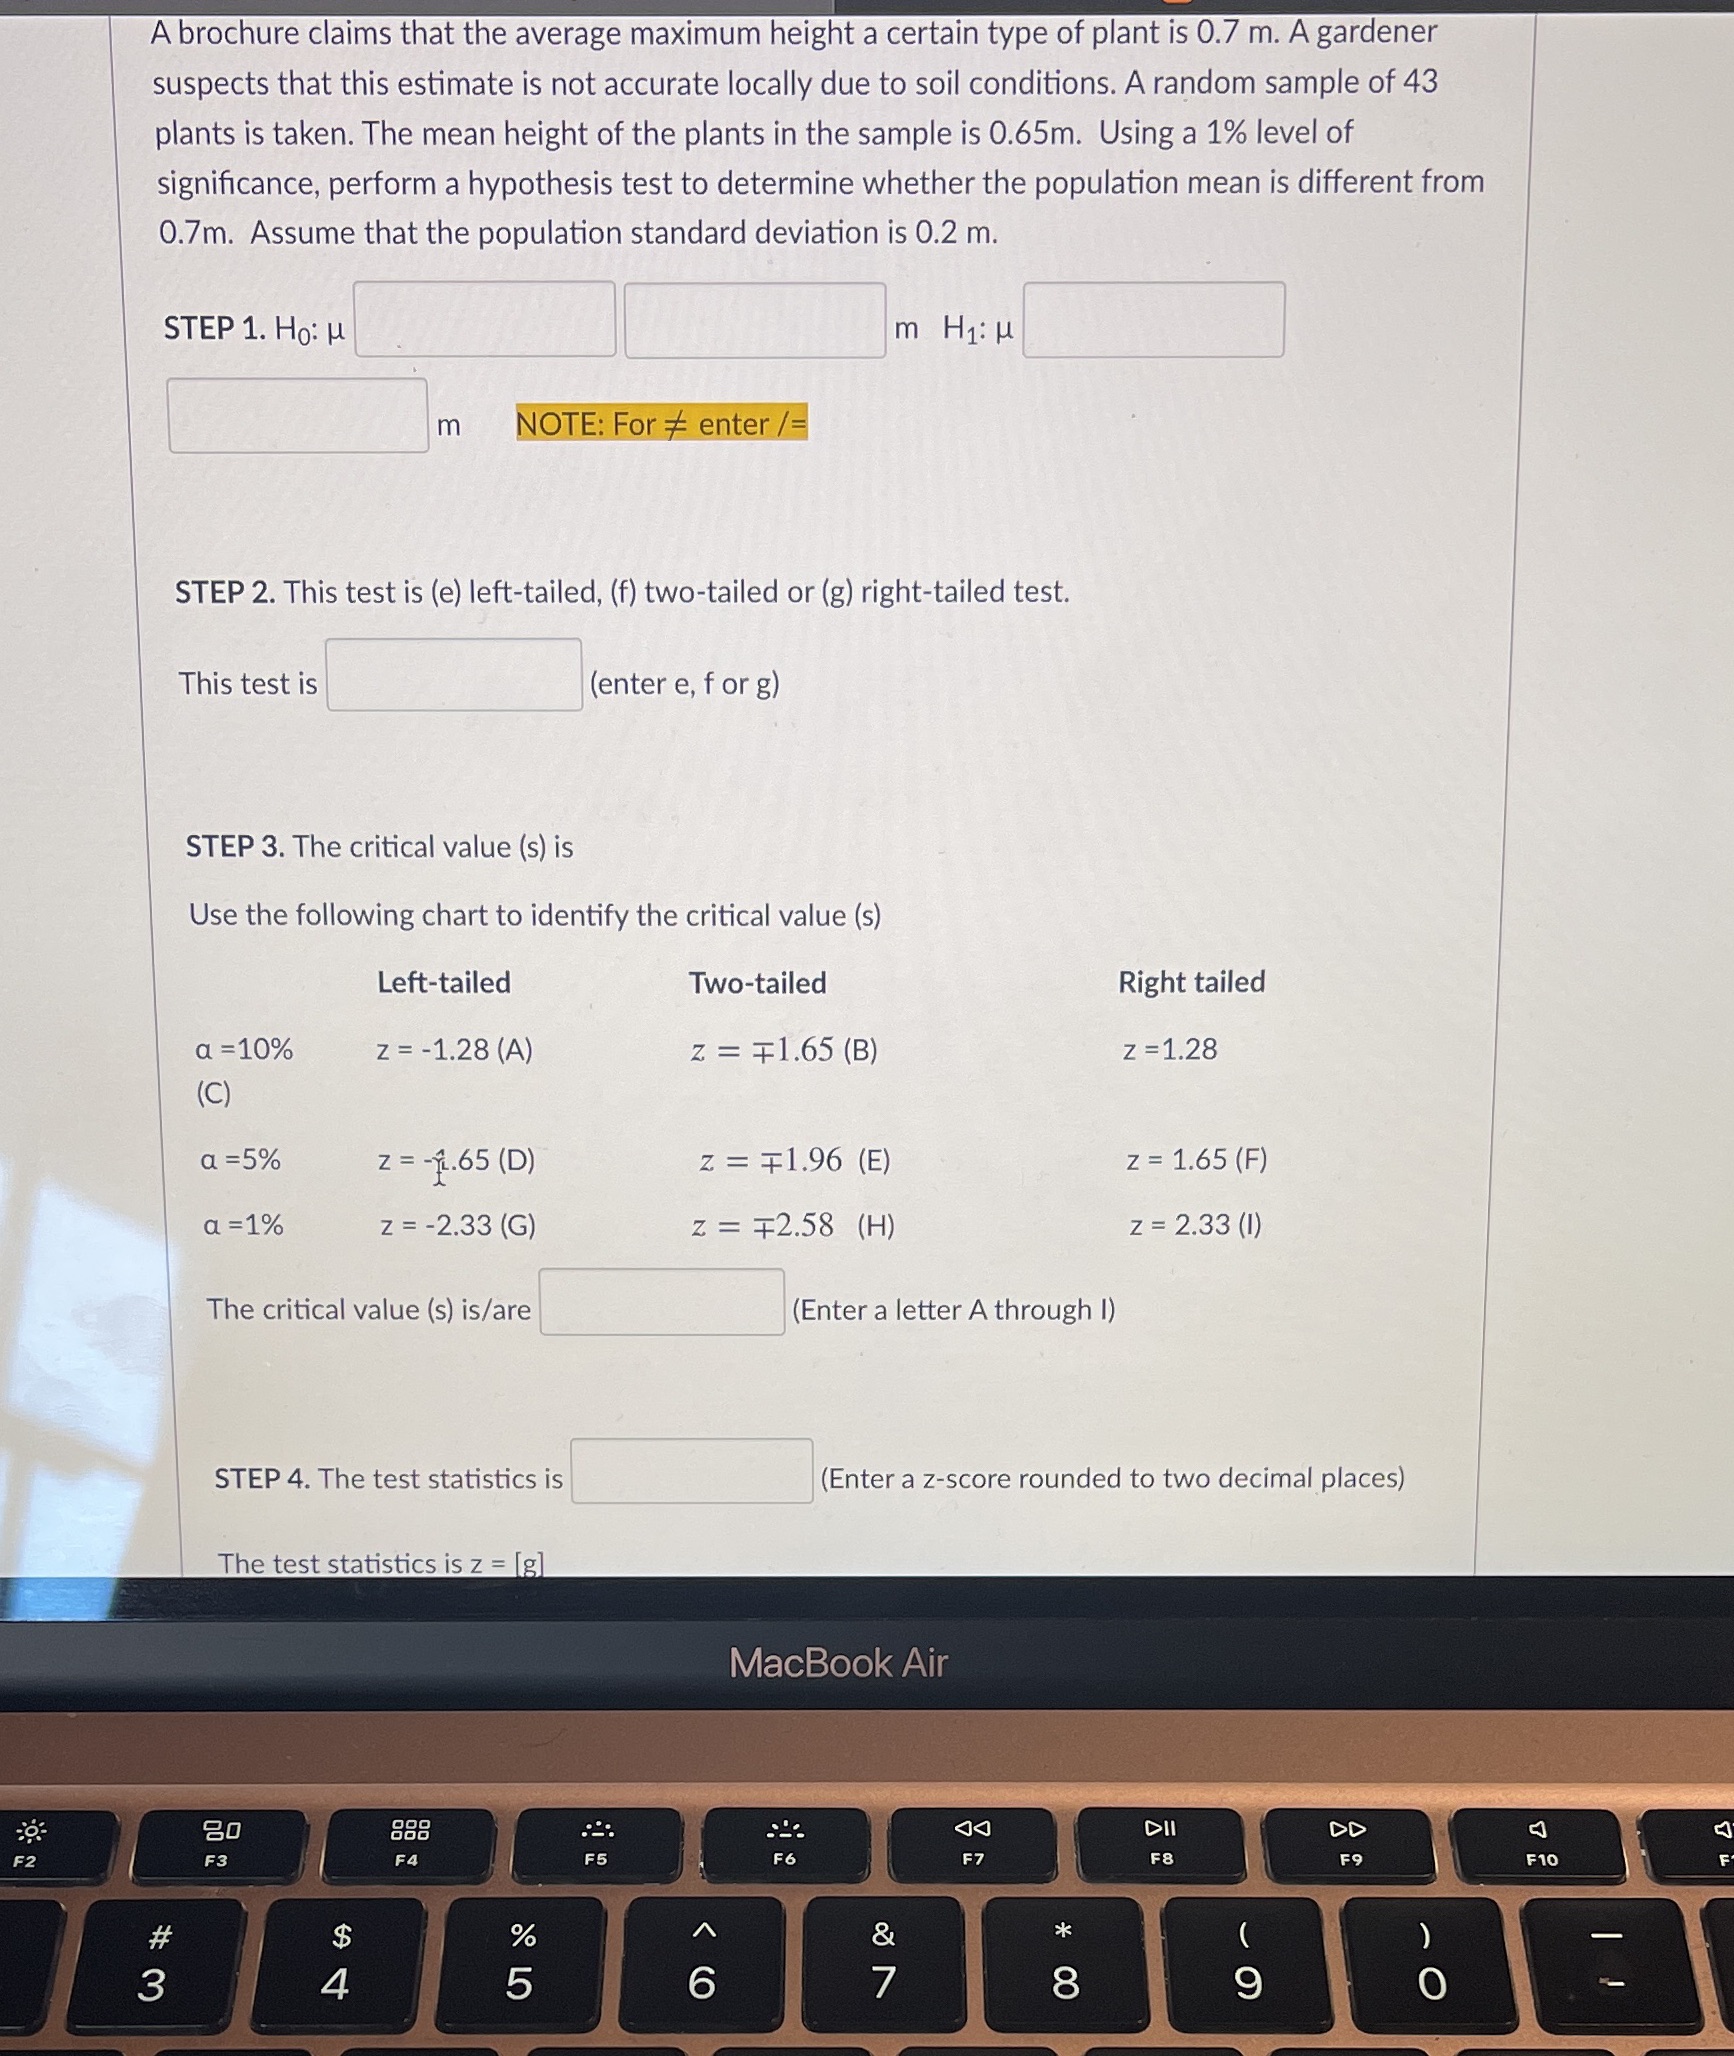
A brochure claims that the average maximum height a certain type of plant is 0.7 m. A gardener suspects that this estimate is not accurate locally due to soil conditions. A random sample of 43 plants is taken. The mean height of the plants in the sample is 0.65m. Using a 1% level of signicance, perform a hypothesis test to determine whetherthe population mean is different from 0.7m. Assume that the population standard deviation is 0.2 m. STEP1.H0'.pl . ll (m Hm) STEP 2. This test is (e) left-tailed, (f) two-tailed or (g) right-tailed test. l This test is l (enter e, f or g) STEP 3. The critical value (5) is Use the following chart to identify the critical value (5) Left-tailed Two-tailed Right tailed c1 =10% = -1.28 (A) Z : 11.65 (B) 2 =1.28 (C) c1=5% z = -}t.65 (D) z = $1.96 (E) z = 1.65 (F) (1 =1% 2 = -2.33 ((3) z = $2.58 (H) z = 2.33 (l) l_ \"##"lw" ; The critical value (5) is/are: J (Enter a letter A through I) , , ,, W, , is? STEP 4. The test statistics is 3 I (Enter a zscore rounded to two decimal places) The test statistics is 2 = - [>11 DD F8 ( F9 9
Step by Step Solution
There are 3 Steps involved in it

Get step-by-step solutions from verified subject matter experts