

Question: A bus makes a trip according to the position-time graph shown in the illustration. What is the average acceleration (in km/h2) of the bus for
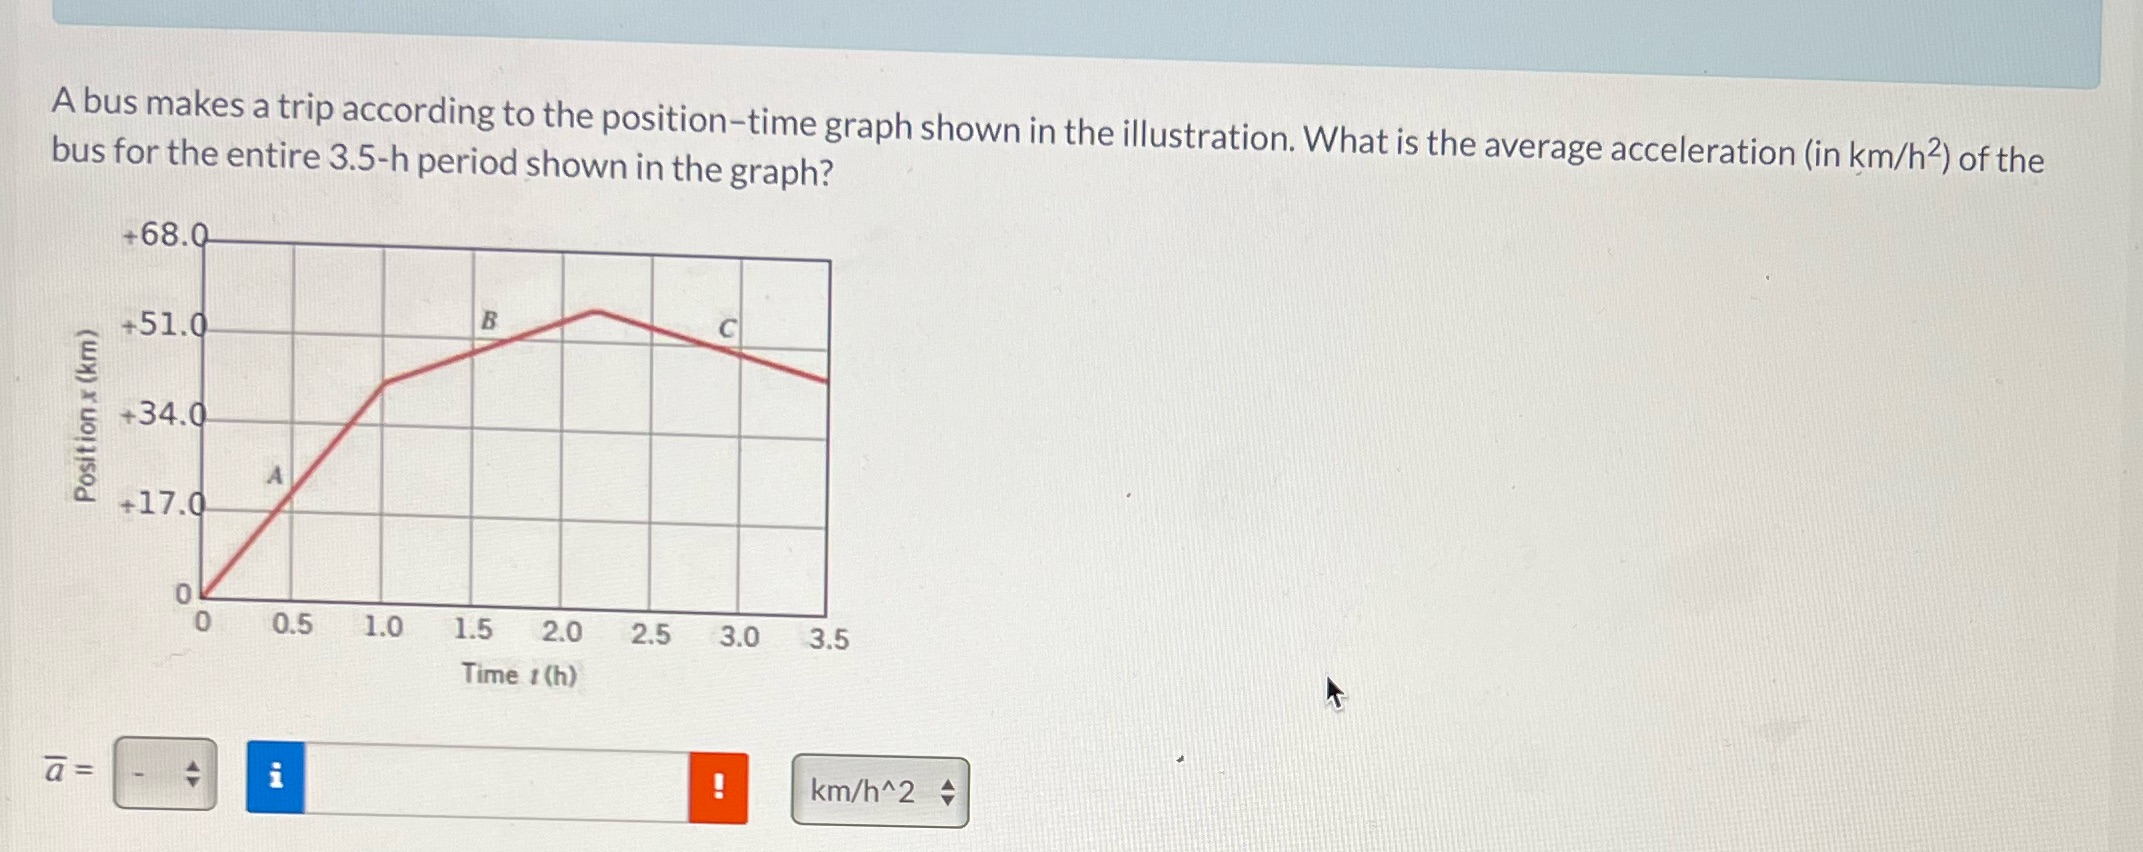
A bus makes a trip according to the position-time graph shown in the illustration. What is the average acceleration (in km/h2) of the bus for the entire 3.5-h period shown in the graph? +68.Q +51.0 Position x (km) +34.0 +17.0 0 0.5 1.0 1.5 2.0 2.5 3.0 3.5 Time 1 (h) a = i km/h^2 4
Step by Step Solution
There are 3 Steps involved in it
1 Expert Approved Answer
Step: 1 Unlock

Question Has Been Solved by an Expert!
Get step-by-step solutions from verified subject matter experts
Step: 2 Unlock
Step: 3 Unlock