

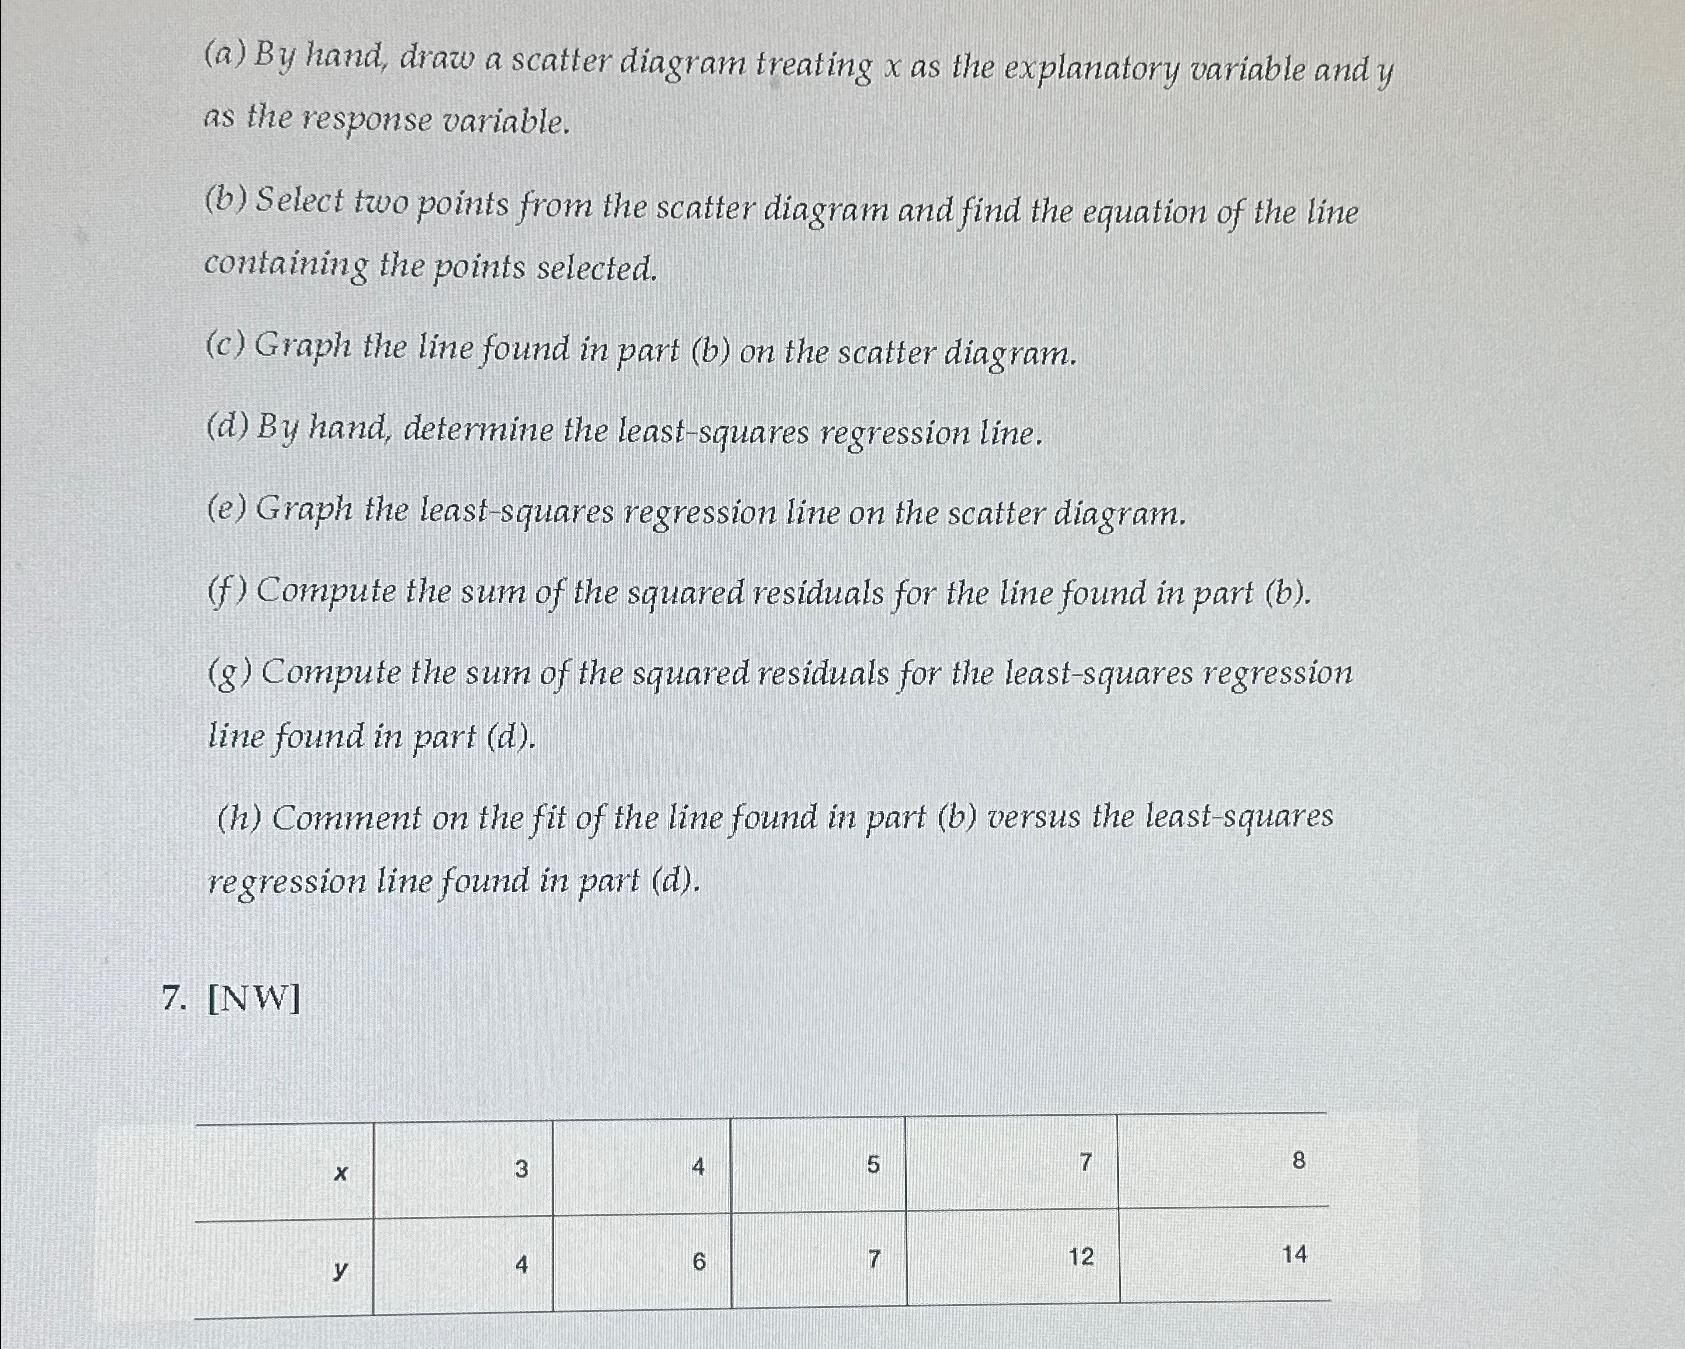
Question: ( a ) By hand, draw a scatter diagram treating x as the explanatory variable and y as the response variable. ( b ) Select
a By hand, draw a scatter diagram treating as the explanatory variable and as the response variable.
b Select two points from the scatter diagram and find the equation of the line containing the points selected.
c Graph the line found in part b on the scatter diagram.
d By hand, determine the leastsquares regression line.
e Graph the leastsquares regression line on the scatter diagram.
f Compute the sum of the squared residuals for the line found in part b
g Compute the sum of the squared residuals for the leastsquares regression line found in part d
h Comment on the fit of the line found in part b versus the leastsquares regression line found in part d
NW
table
Step by Step Solution
There are 3 Steps involved in it
1 Expert Approved Answer
Step: 1 Unlock

Question Has Been Solved by an Expert!
Get step-by-step solutions from verified subject matter experts
Step: 2 Unlock
Step: 3 Unlock