

Question: a) Calculate the continuation value in 2010 below:(Round the dollar amounts to the nearest $ 000.) b) The EV/Sales multiple is? c) The unlevered P/E
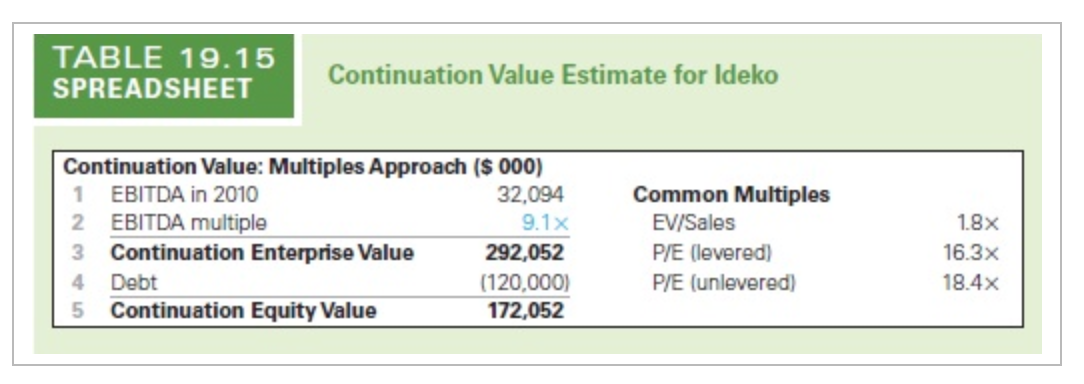
a) Calculate the continuation value in 2010 below:(Round the dollar amounts to the nearest $ 000.)
b) The EV/Sales multiple is?
c) The unlevered P/E ration is?
d) The levered P/E ratio is?
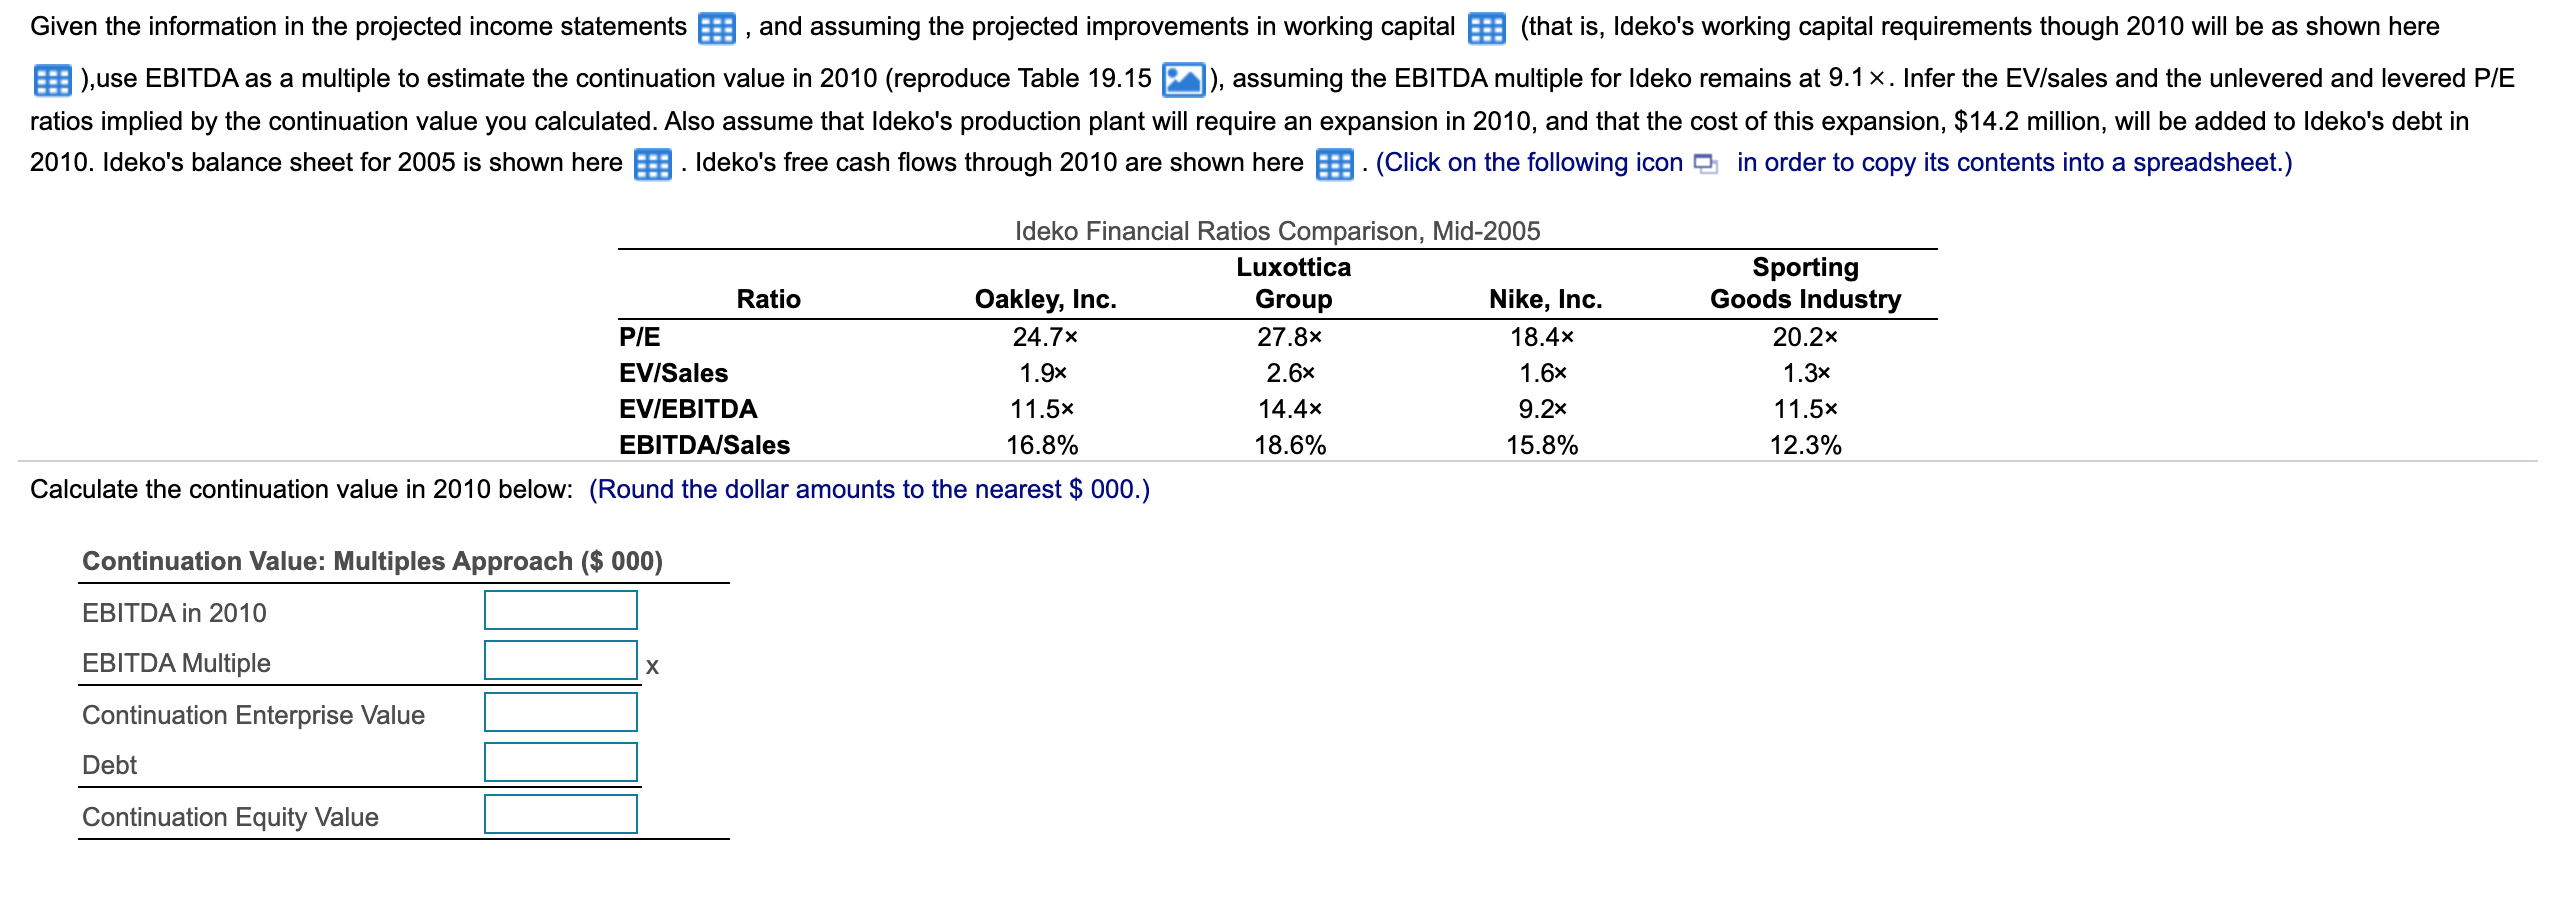
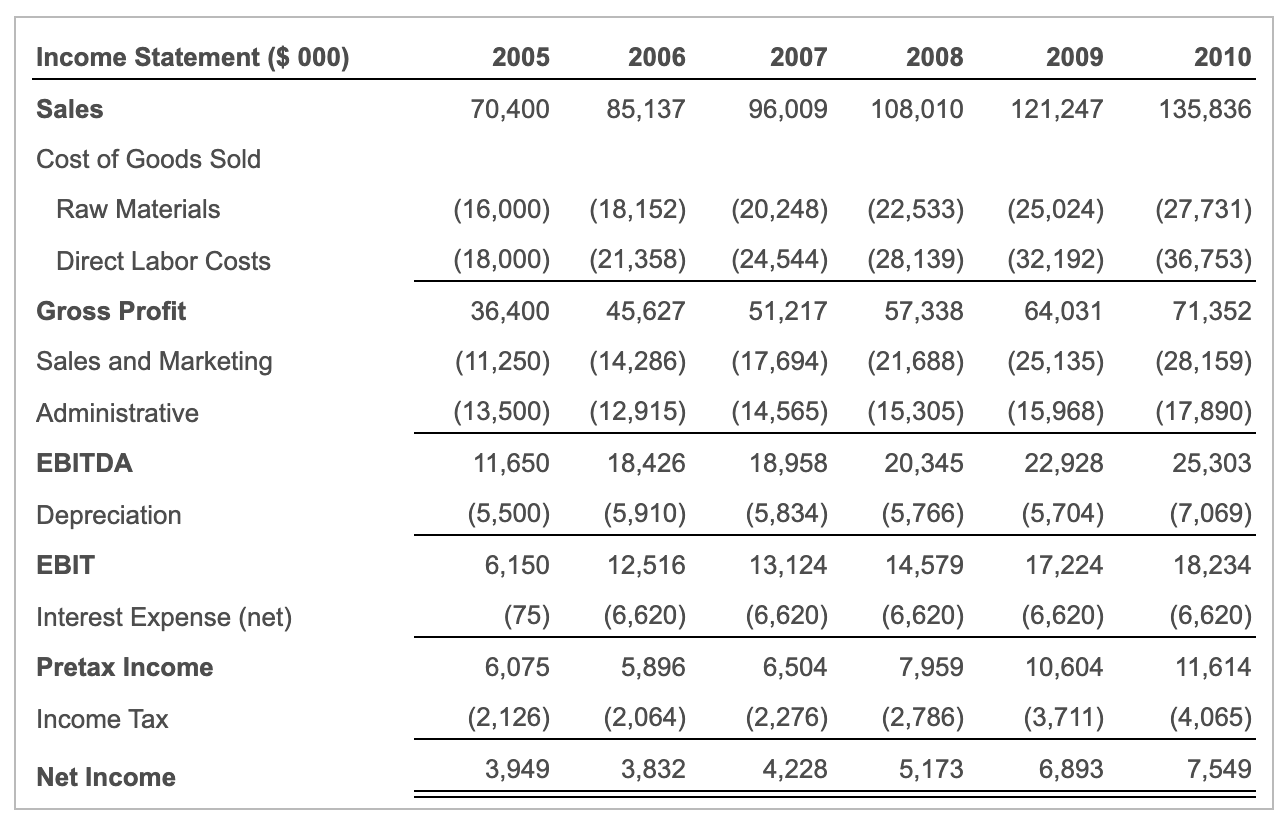
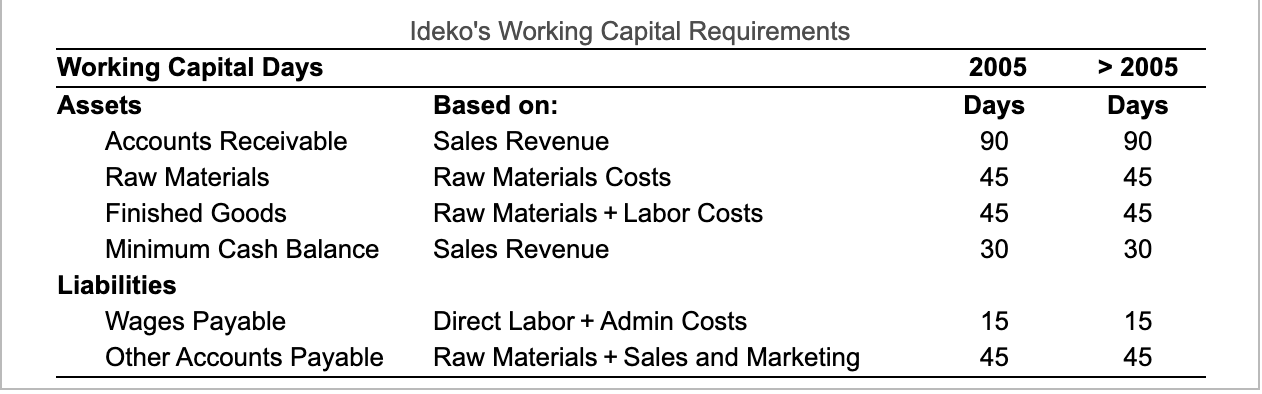
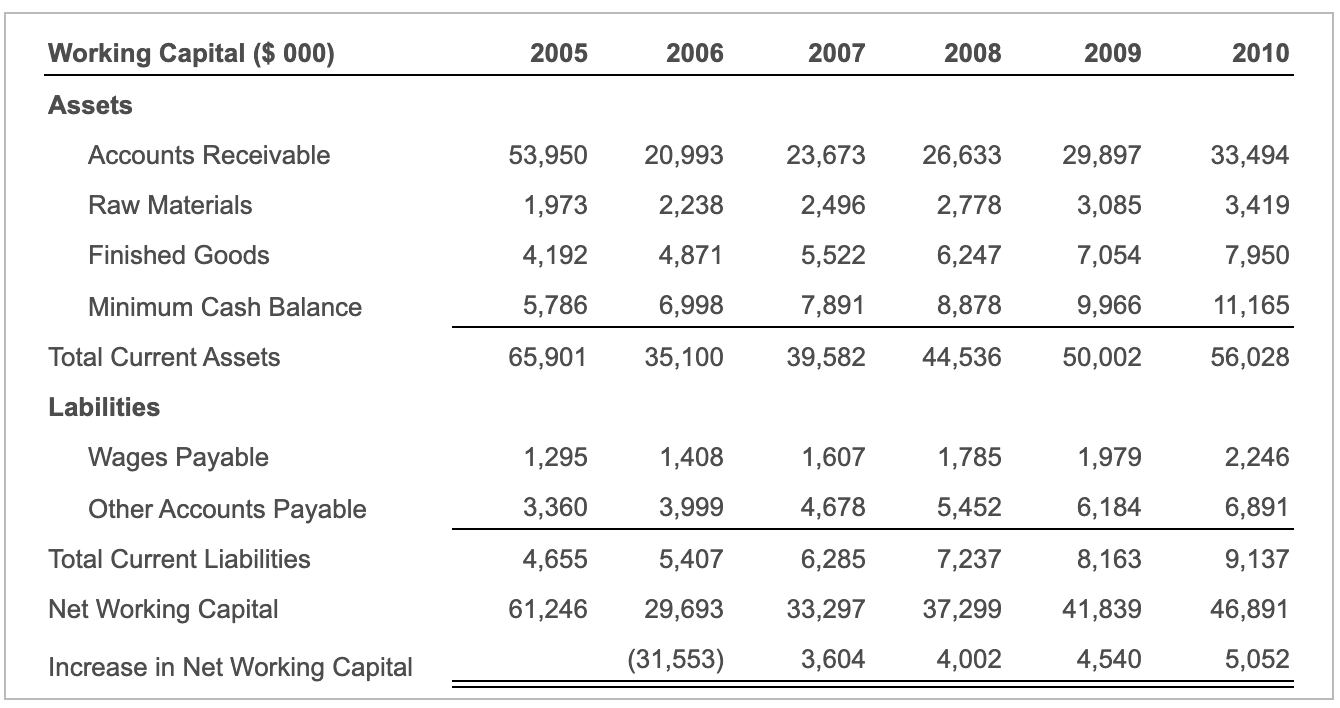
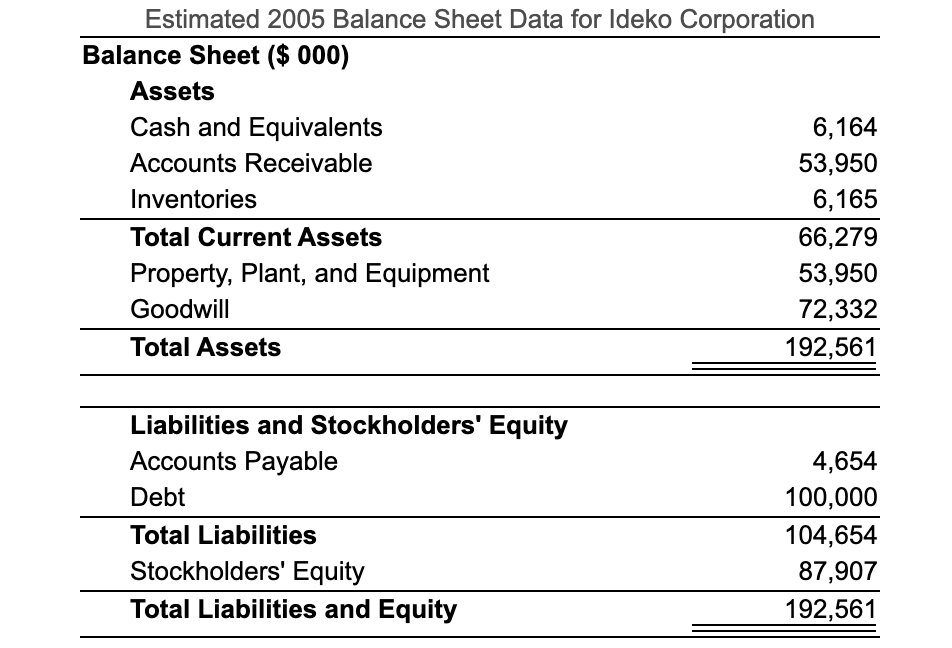
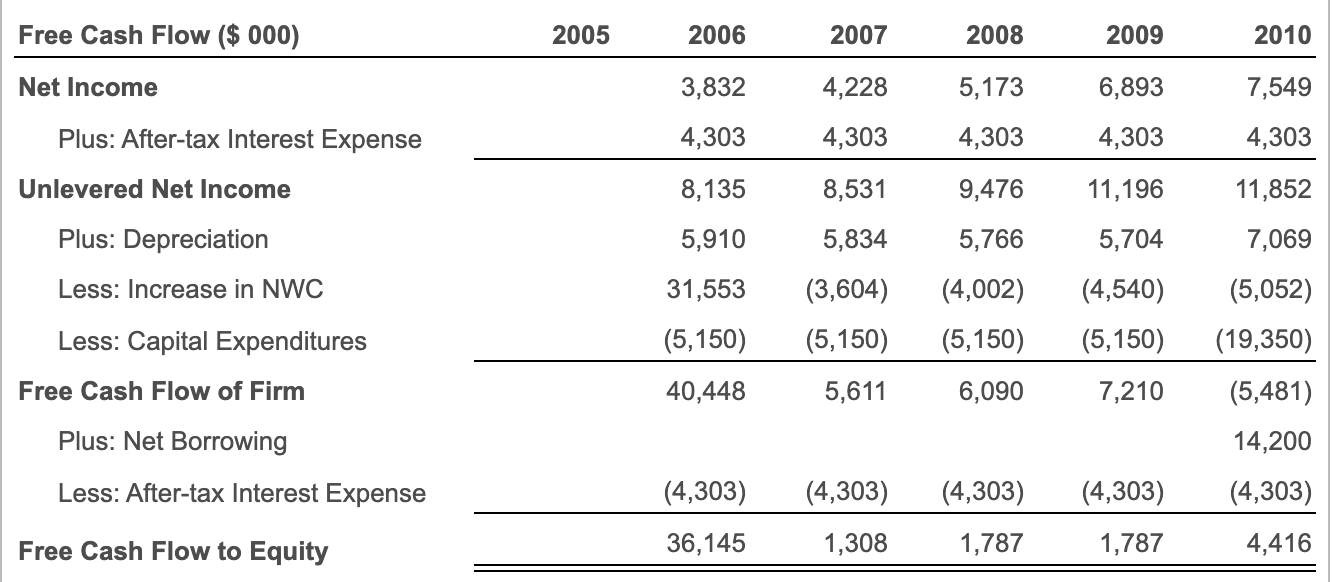
Income Statement ($ 000) 2005 2006 2007 2008 2009 2010 Sales 70,400 85,137 96,009 108,010 121,247 135,836 Cost of Goods Sold Raw Materials (16,000) (18,152) (18,000) (21,358) (20,248) (24,544) (22,533) (28,139) (25,024) (32,192) (27,731) (36,753) Direct Labor Costs Gross Profit 36,400 45,627 51,217 57,338 64,031 71,352 Sales and Marketing (25,135) (11,250) (14,286) (13,500) (12,915) (17,694) (21,688) (14,565) (15,305) (28,159) (17,890) Administrative (15,968) EBITDA 11,650 18,426 18,958 20,345 22,928 25,303 Depreciation (5,500) (5,910) (5,834) (5,766) (5,704) (7,069) EBIT 6,150 12,516 13,124 17,224 18,234 14,579 (6,620) Interest Expense (net) (75) (6,620) (6,620) (6,620) (6,620) Pretax Income 5,896 6,504 7,959 10,604 11,614 6,075 (2,126) Income Tax (2,064) (2,276) (2,786) (3,711) (4,065) Net Income 3,949 3,832 4,228 5,173 6,893 7,549 Ideko's Working Capital Requirements Working Capital Days Assets Accounts Receivable Raw Materials Finished Goods Minimum Cash Balance Liabilities Wages Payable Other Accounts Payable Based on: Sales Revenue Raw Materials Costs Raw Materials + Labor Costs Sales Revenue 2005 Days 90 45 45 > 2005 Days 90 45 45 30 30 Direct Labor + Admin Costs Raw Materials + Sales and Marketing 15 45 15 45 Working Capital ($ 000) 2005 2006 2007 2008 2009 2010 Assets Accounts Receivable 53,950 20,993 23,673 26,633 29,897 33,494 Raw Materials 1,973 2,238 2,496 2,778 3,085 3,419 Finished Goods 4,192 4,871 5,522 6,247 7,054 7,950 Minimum Cash Balance 5,786 6,998 7,891 8,878 9,966 11,165 Total Current Assets 65,901 35,100 39,582 44,536 50,002 56,028 Labilities Wages Payable 1,295 1,408 1,607 1,785 1,979 2,246 Other Accounts Payable 3,360 3,999 4,678 5,452 6,184 6,891 Total Current Liabilities 4,655 5,407 6,285 7,237 8,163 9,137 Net Working Capital 61,246 29,693 33,297 37,299 41,839 46,891 Increase in Net Working Capital (31,553) 3,604 4,002 4,540 5,052 TABLE 19.15 SPREADSHEET Continuation Value Estimate for Ideko Continuation Value: Multiples Approach ($ 000) 1 EBITDA in 2010 32,094 2 EBITDA multiple 9.1 x 3 Continuation Enterprise Value 292,052 4 Debt (120,000) 5 Continuation Equity Value 172,052 Common Multiples EV/Sales P/E (levered) P/E (unlevered) 1.8% 16.3x 18.4x Estimated 2005 Balance Sheet Data for Ideko Corporation Balance Sheet ($ 000) Assets Cash and Equivalents 6,164 Accounts Receivable 53,950 Inventories 6,165 Total Current Assets 66,279 Property, Plant, and Equipment 53,950 Goodwill 72,332 Total Assets 192,561 Liabilities and Stockholders' Equity Accounts Payable Debt Total Liabilities Stockholders' Equity Total Liabilities and Equity 4,654 100,000 104,654 87,907 192,561 Free Cash Flow ($ 000) 2005 2006 2007 2008 2009 2010 Net Income 3,832 4,228 5,173 6,893 7,549 4,303 4,303 4,303 4,303 4,303 Plus: After-tax Interest Expense Unlevered Net Income Plus: Depreciation 8,135 8,531 9,476 11,196 11,852 5,910 5,766 7,069 5,834 (3,604) 5,704 (4,540) Less: Increase in NWC 31,553 (4,002) (5,150) Less: Capital Expenditures (5,150) (5,150) (5,150) Free Cash Flow of Firm 40,448 5,611 6,090 7,210 (5,052) (19,350) (5,481) 14,200 (4,303) Plus: Net Borrowing Less: After-tax Interest Expense (4,303) (4,303) (4,303) (4,303) Free Cash Flow to Equity 36,145 1,308 1,787 1,787 4,416 Given the information in the projected income statements B, and assuming the projected improvements in working capital E (that is, Ideko's working capital requirements though 2010 will be as shown here E ),use EBITDA as a multiple to estimate the continuation value in 2010 (reproduce Table 19.15 ]), assuming the EBITDA multiple for Ideko remains at 9.1x. Infer the EV/sales and the unlevered and levered P/E ratios implied by the continuation value you calculated. Also assume that Ideko's production plant will require an expansion in 2010, and that the cost of this expansion, $14.2 million, will be added to Ideko's debt in 2010. Ideko's balance sheet for 2005 is shown here . Ideko's free cash flows through 2010 are shown here : - (Click on the following icon e in order to copy its contents into a spreadsheet.) Ideko Financial Ratios Comparison, Mid-2005 Luxottica Ratio Oakley, Inc. Group Nike, Inc. PIE 24.7* 27.8x 18.4x EV/Sales 1.9x 2.6x 1.6x EV/EBITDA 11.5x 14.4x 9.2x EBITDA/Sales 16.8% 18.6% 15.8% Calculate the continuation value in 2010 below: (Round the dollar amounts to the nearest $ 000.) Sporting Goods Industry 20.2x 1.3x 11.5x 12.3% Continuation Value: Multiples Approach ($ 000) EBITDA in 2010 EBITDA Multiple Continuation Enterprise Value Debt Continuation Equity Value Income Statement ($ 000) 2005 2006 2007 2008 2009 2010 Sales 70,400 85,137 96,009 108,010 121,247 135,836 Cost of Goods Sold Raw Materials (16,000) (18,152) (18,000) (21,358) (20,248) (24,544) (22,533) (28,139) (25,024) (32,192) (27,731) (36,753) Direct Labor Costs Gross Profit 36,400 45,627 51,217 57,338 64,031 71,352 Sales and Marketing (25,135) (11,250) (14,286) (13,500) (12,915) (17,694) (21,688) (14,565) (15,305) (28,159) (17,890) Administrative (15,968) EBITDA 11,650 18,426 18,958 20,345 22,928 25,303 Depreciation (5,500) (5,910) (5,834) (5,766) (5,704) (7,069) EBIT 6,150 12,516 13,124 17,224 18,234 14,579 (6,620) Interest Expense (net) (75) (6,620) (6,620) (6,620) (6,620) Pretax Income 5,896 6,504 7,959 10,604 11,614 6,075 (2,126) Income Tax (2,064) (2,276) (2,786) (3,711) (4,065) Net Income 3,949 3,832 4,228 5,173 6,893 7,549 Ideko's Working Capital Requirements Working Capital Days Assets Accounts Receivable Raw Materials Finished Goods Minimum Cash Balance Liabilities Wages Payable Other Accounts Payable Based on: Sales Revenue Raw Materials Costs Raw Materials + Labor Costs Sales Revenue 2005 Days 90 45 45 > 2005 Days 90 45 45 30 30 Direct Labor + Admin Costs Raw Materials + Sales and Marketing 15 45 15 45 Working Capital ($ 000) 2005 2006 2007 2008 2009 2010 Assets Accounts Receivable 53,950 20,993 23,673 26,633 29,897 33,494 Raw Materials 1,973 2,238 2,496 2,778 3,085 3,419 Finished Goods 4,192 4,871 5,522 6,247 7,054 7,950 Minimum Cash Balance 5,786 6,998 7,891 8,878 9,966 11,165 Total Current Assets 65,901 35,100 39,582 44,536 50,002 56,028 Labilities Wages Payable 1,295 1,408 1,607 1,785 1,979 2,246 Other Accounts Payable 3,360 3,999 4,678 5,452 6,184 6,891 Total Current Liabilities 4,655 5,407 6,285 7,237 8,163 9,137 Net Working Capital 61,246 29,693 33,297 37,299 41,839 46,891 Increase in Net Working Capital (31,553) 3,604 4,002 4,540 5,052 TABLE 19.15 SPREADSHEET Continuation Value Estimate for Ideko Continuation Value: Multiples Approach ($ 000) 1 EBITDA in 2010 32,094 2 EBITDA multiple 9.1 x 3 Continuation Enterprise Value 292,052 4 Debt (120,000) 5 Continuation Equity Value 172,052 Common Multiples EV/Sales P/E (levered) P/E (unlevered) 1.8% 16.3x 18.4x Estimated 2005 Balance Sheet Data for Ideko Corporation Balance Sheet ($ 000) Assets Cash and Equivalents 6,164 Accounts Receivable 53,950 Inventories 6,165 Total Current Assets 66,279 Property, Plant, and Equipment 53,950 Goodwill 72,332 Total Assets 192,561 Liabilities and Stockholders' Equity Accounts Payable Debt Total Liabilities Stockholders' Equity Total Liabilities and Equity 4,654 100,000 104,654 87,907 192,561 Free Cash Flow ($ 000) 2005 2006 2007 2008 2009 2010 Net Income 3,832 4,228 5,173 6,893 7,549 4,303 4,303 4,303 4,303 4,303 Plus: After-tax Interest Expense Unlevered Net Income Plus: Depreciation 8,135 8,531 9,476 11,196 11,852 5,910 5,766 7,069 5,834 (3,604) 5,704 (4,540) Less: Increase in NWC 31,553 (4,002) (5,150) Less: Capital Expenditures (5,150) (5,150) (5,150) Free Cash Flow of Firm 40,448 5,611 6,090 7,210 (5,052) (19,350) (5,481) 14,200 (4,303) Plus: Net Borrowing Less: After-tax Interest Expense (4,303) (4,303) (4,303) (4,303) Free Cash Flow to Equity 36,145 1,308 1,787 1,787 4,416 Given the information in the projected income statements B, and assuming the projected improvements in working capital E (that is, Ideko's working capital requirements though 2010 will be as shown here E ),use EBITDA as a multiple to estimate the continuation value in 2010 (reproduce Table 19.15 ]), assuming the EBITDA multiple for Ideko remains at 9.1x. Infer the EV/sales and the unlevered and levered P/E ratios implied by the continuation value you calculated. Also assume that Ideko's production plant will require an expansion in 2010, and that the cost of this expansion, $14.2 million, will be added to Ideko's debt in 2010. Ideko's balance sheet for 2005 is shown here . Ideko's free cash flows through 2010 are shown here : - (Click on the following icon e in order to copy its contents into a spreadsheet.) Ideko Financial Ratios Comparison, Mid-2005 Luxottica Ratio Oakley, Inc. Group Nike, Inc. PIE 24.7* 27.8x 18.4x EV/Sales 1.9x 2.6x 1.6x EV/EBITDA 11.5x 14.4x 9.2x EBITDA/Sales 16.8% 18.6% 15.8% Calculate the continuation value in 2010 below: (Round the dollar amounts to the nearest $ 000.) Sporting Goods Industry 20.2x 1.3x 11.5x 12.3% Continuation Value: Multiples Approach ($ 000) EBITDA in 2010 EBITDA Multiple Continuation Enterprise Value Debt Continuation Equity Value
Step by Step Solution
There are 3 Steps involved in it

Get step-by-step solutions from verified subject matter experts