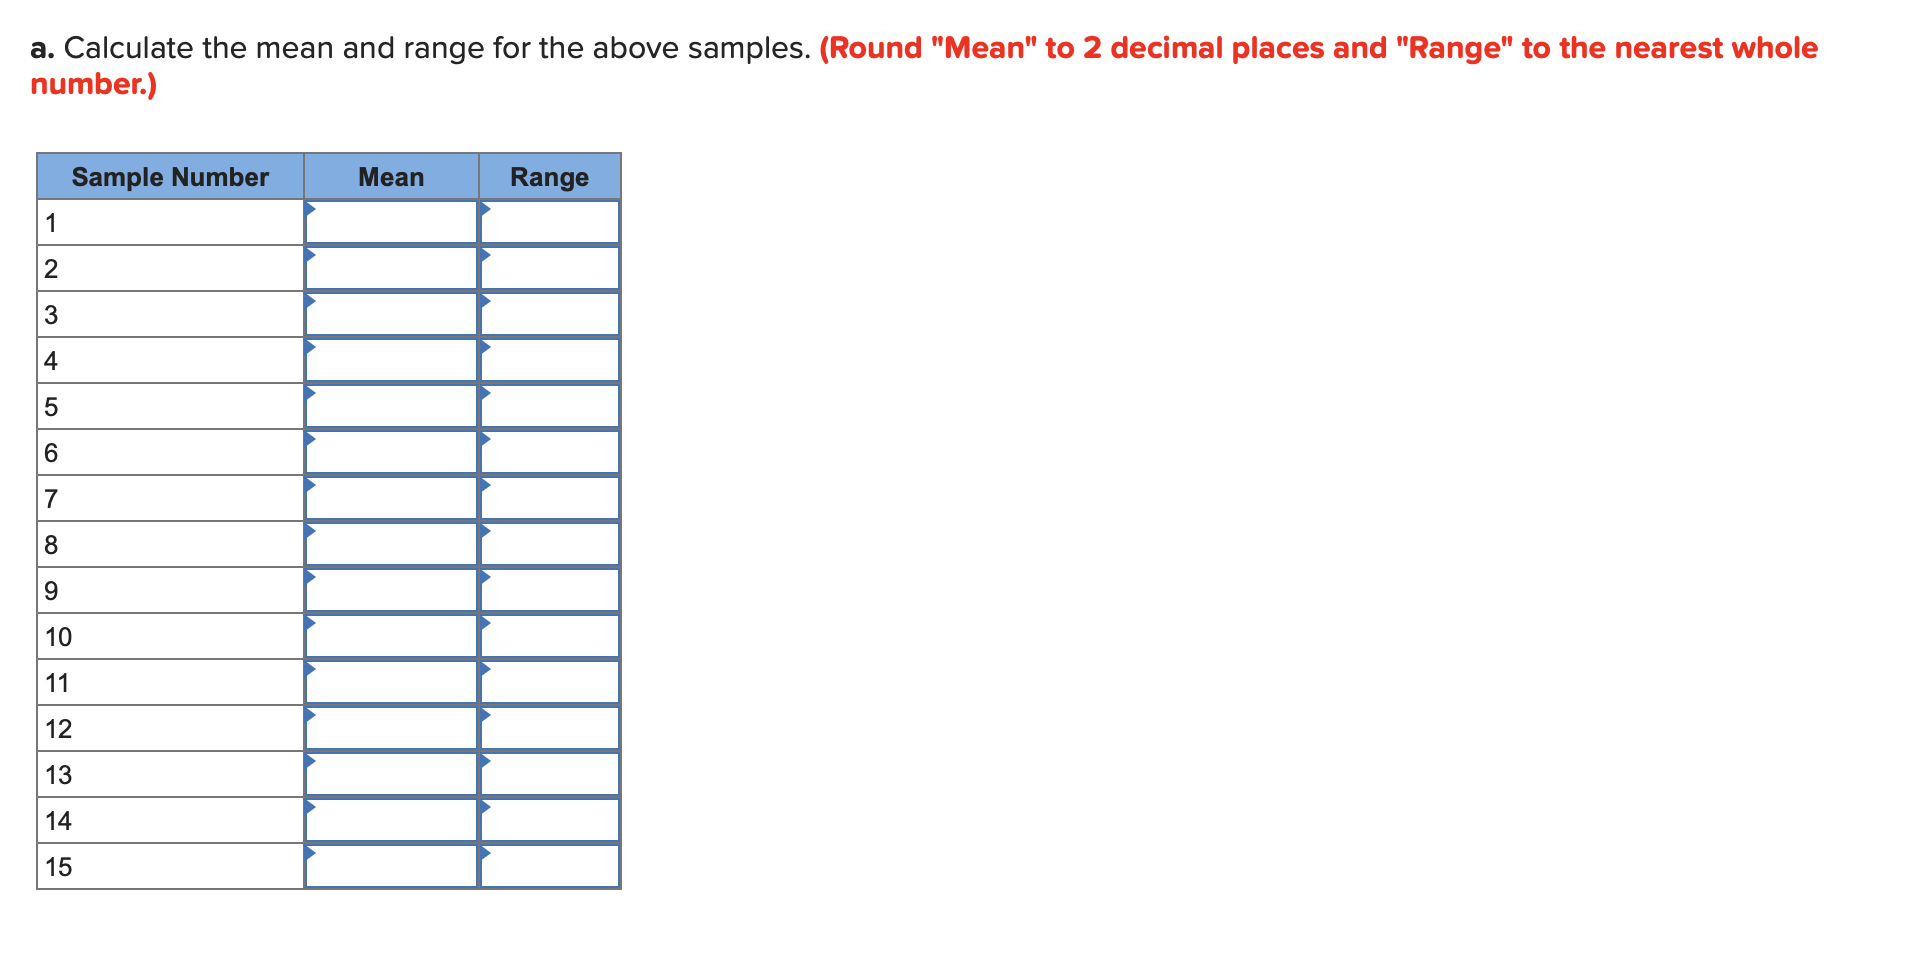
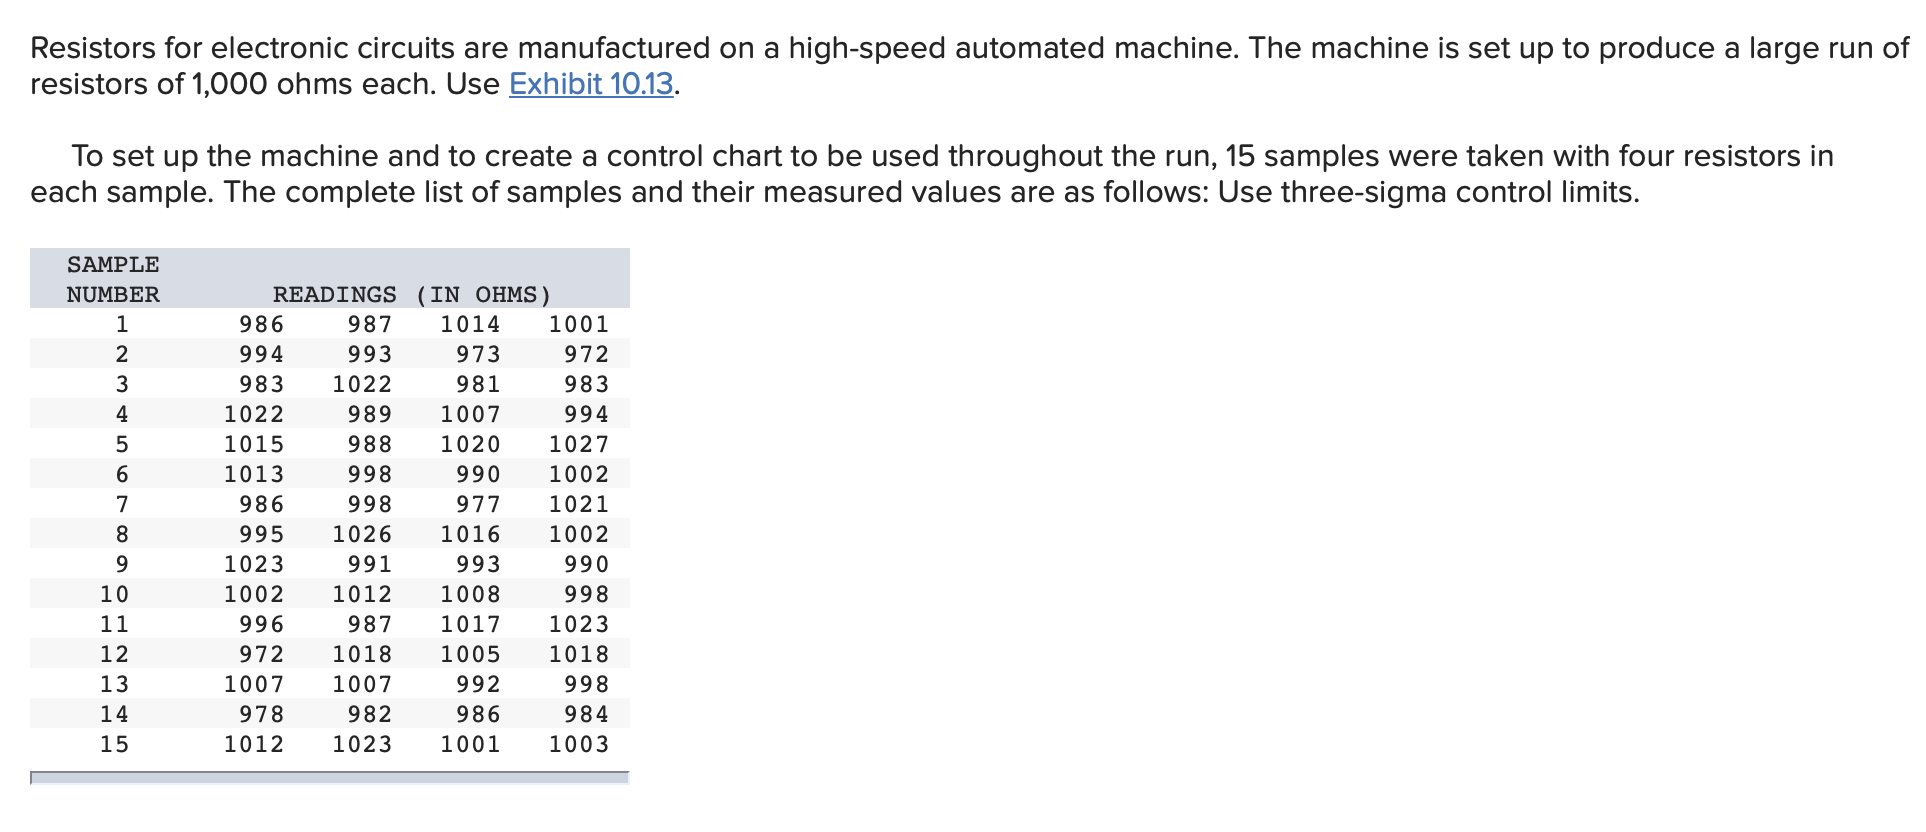
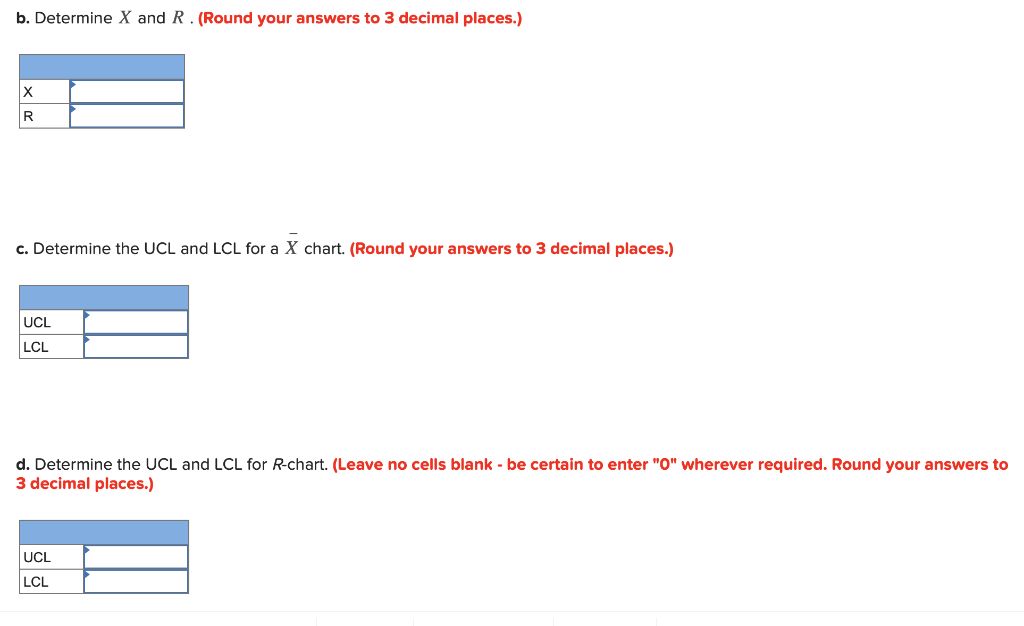
Question: a. Calculate the mean and range for the above samples. (Round Mean to 2 decimal places and Range to the nearest whole number.) Sample Number

a. Calculate the mean and range for the abovea. Calculate the mean and range for the abovea. Calculate the mean and range for the above

a. Calculate the mean and range for the above samples. (Round "Mean" to 2 decimal places and "Range" to the nearest whole number.) Sample Number Mean Range 1 2 3 4 5 6 7 8 9 10 11 12 13 14 15 Resistors for electronic circuits are manufactured on a high-speed automated machine. The machine is set up to produce a large run of resistors of 1,000 ohms each. Use Exhibit 10.13. To set up the machine and to create a control chart to be used throughout the run, 15 samples were taken with four resistors in each sample. The complete list of samples and their measured values are as follows: Use three-sigma control limits. SAMPLE NUMBER 1 2 3 4 ML 5 6 7 8 9 10 11 12 13 14 15 READINGS 986 987 994 993 983 1022 1022 989 1015 988 1013 998 986 998 995 1026 1023 991 1002 1012 996 987 972 1018 1007 1007 978 982 1012 1023 IN OHMS) 1014 1001 973 972 981 983 1007 994 1020 1027 990 1002 977 1021 1016 1002 993 990 1008 998 1017 1023 1005 1018 992 998 986 984 1001 1003 U AWNPO00 b. Determine X and R. (Round your answers to 3 decimal places.) X R c. Determine the UCL and LCL for a X chart. (Round your answers to 3 decimal places.) UCL LCL d. Determine the UCL and LCL for R-chart. (Leave no cells blank - be certain to enter "O" wherever required. Round your answers to 3 decimal places.) UCL LCL

Step by Step Solution

There are 3 Steps involved in it

1 Expert Approved Answer
Step: 1 Unlock blur-text-image
Question Has Been Solved by an Expert!

Get step-by-step solutions from verified subject matter experts

Step: 2 Unlock
Step: 3 Unlock

Students Have Also Explored These Related General Management Questions!