

Question: (a) Choose a scatter chart below with weekly usage as the independent variable. (i) (ii) What does the scatter chart indicate about the relationship between
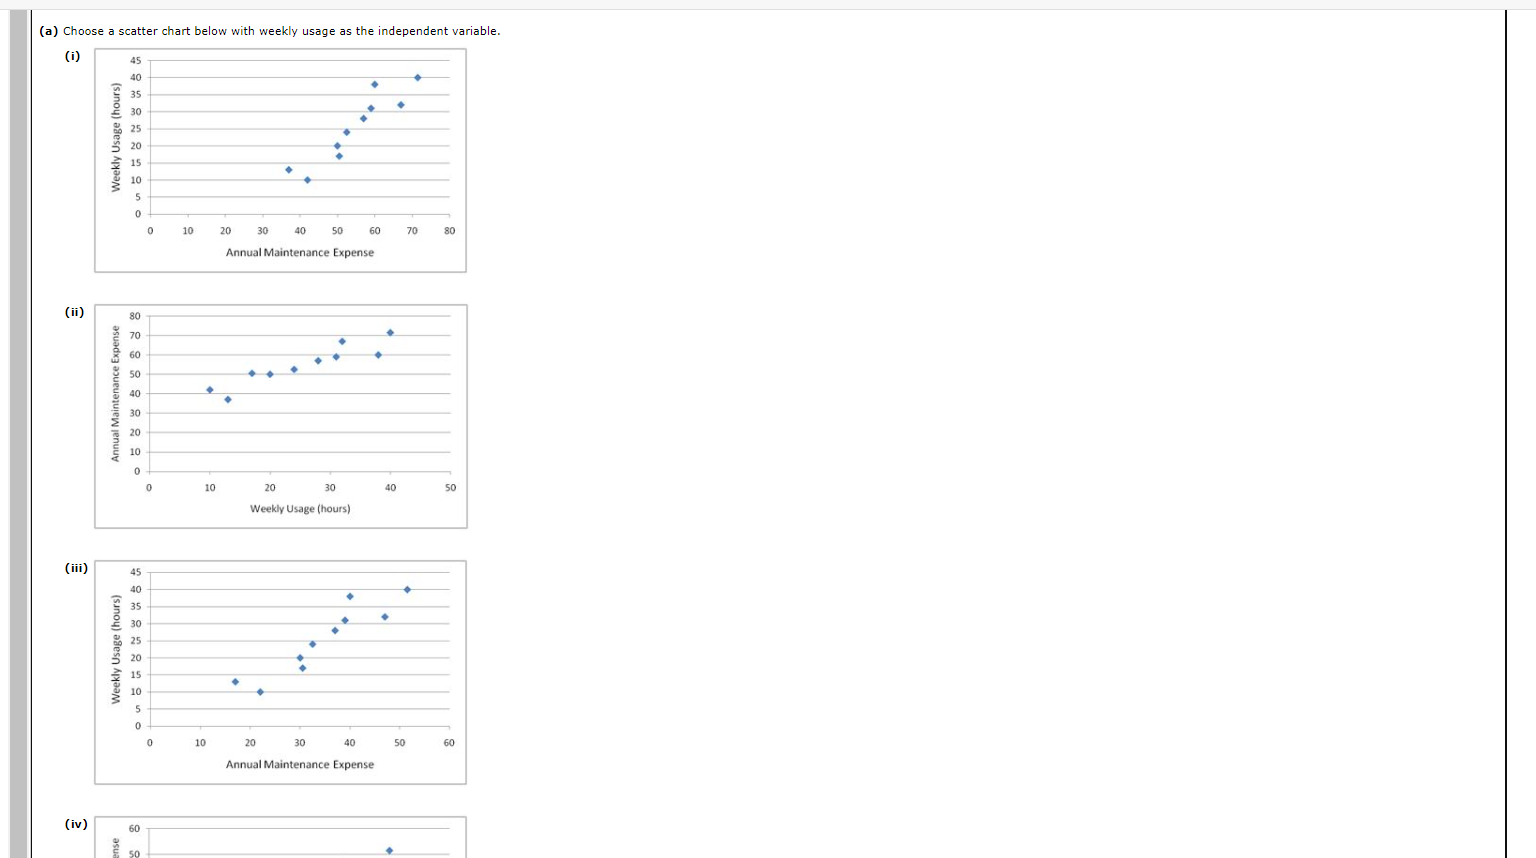
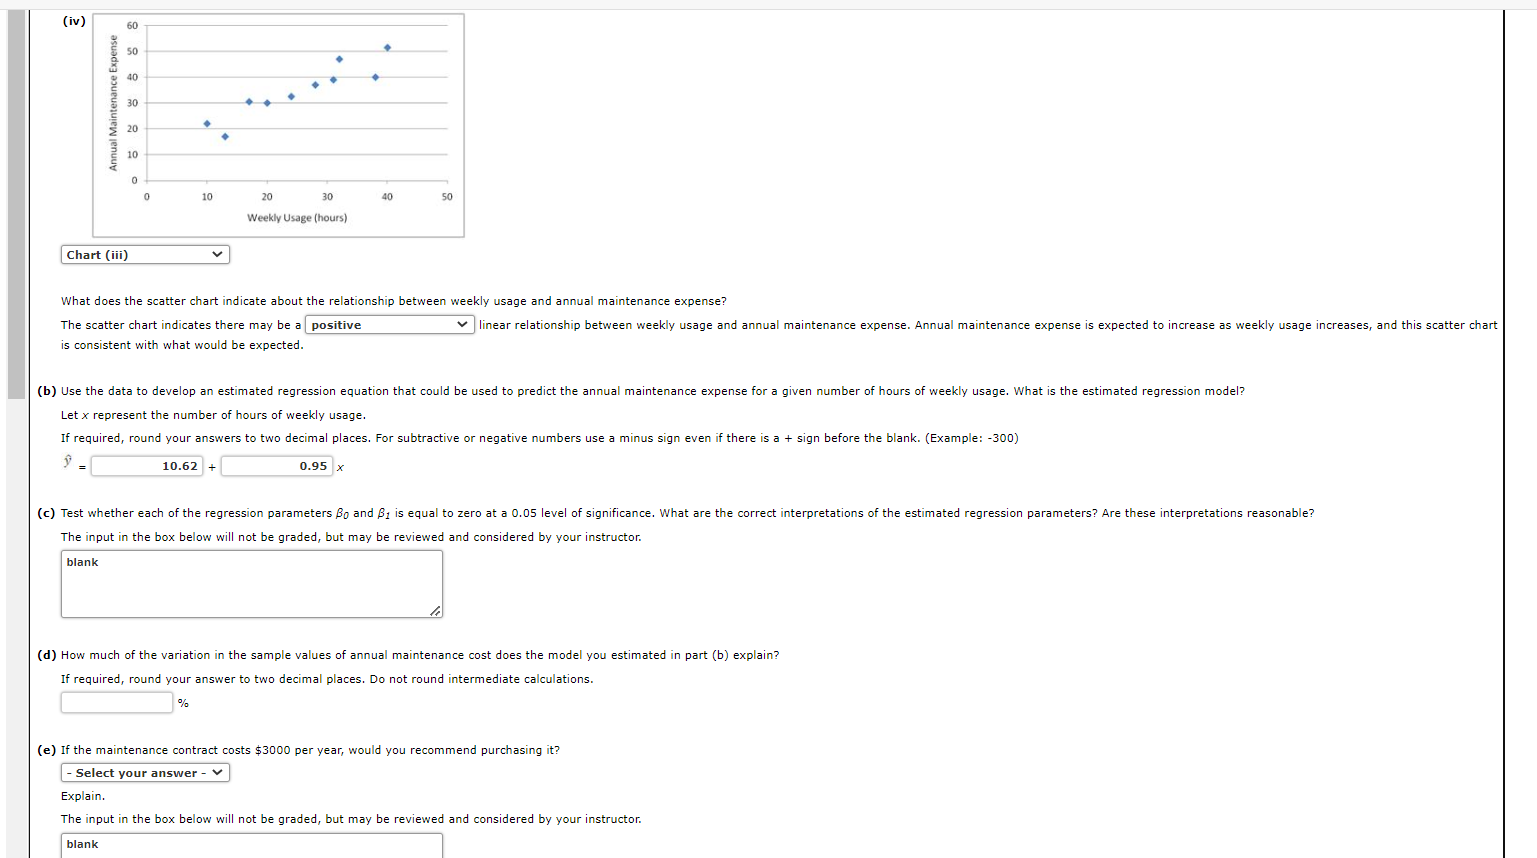
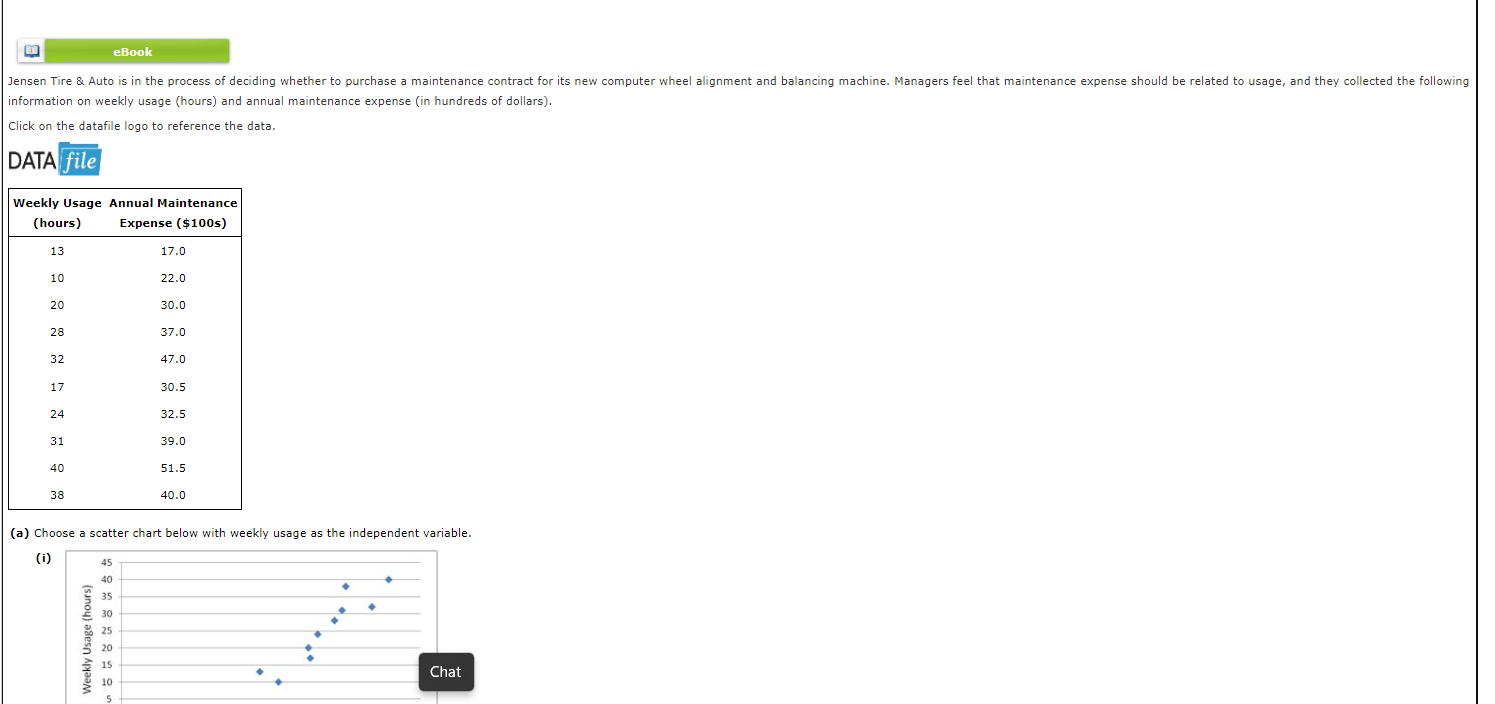
(a) Choose a scatter chart below with weekly usage as the independent variable. (i) (ii) What does the scatter chart indicate about the relationship between weekly usage and annual maintenance expense? The scatter chart indicates there may be a is consistent with what would be expected. Let x represent the number of hours of weekly usage. y^= x The input in the box below will not be graded, but may be reviewed and considered by your instructor: (d) How much of the variation in the sample values of annual maintenance cost does the model you estimated in part (b) explain? If required, round your answer to two decimal places. Do not round intermediate calculations. % (e) If the maintenance contract costs $3000 per year, would you recommend purchasing it? Explain. The input in the box below will not be graded, but may be reviewed and considered by your instructor: information on weekly usage (hours) and annual maintenance expense (in hundreds of dollars). Click on the datafile logo to reference the data. DATA (a) Choose a scatter chart below with weekly usage as the independent variable
Step by Step Solution
There are 3 Steps involved in it

Get step-by-step solutions from verified subject matter experts