

Question: (a) Choose the correct time series plot. (i) 45 (iii) 40 35 WV 30 chmor fras 25 20 35 30 25 15 10- 5
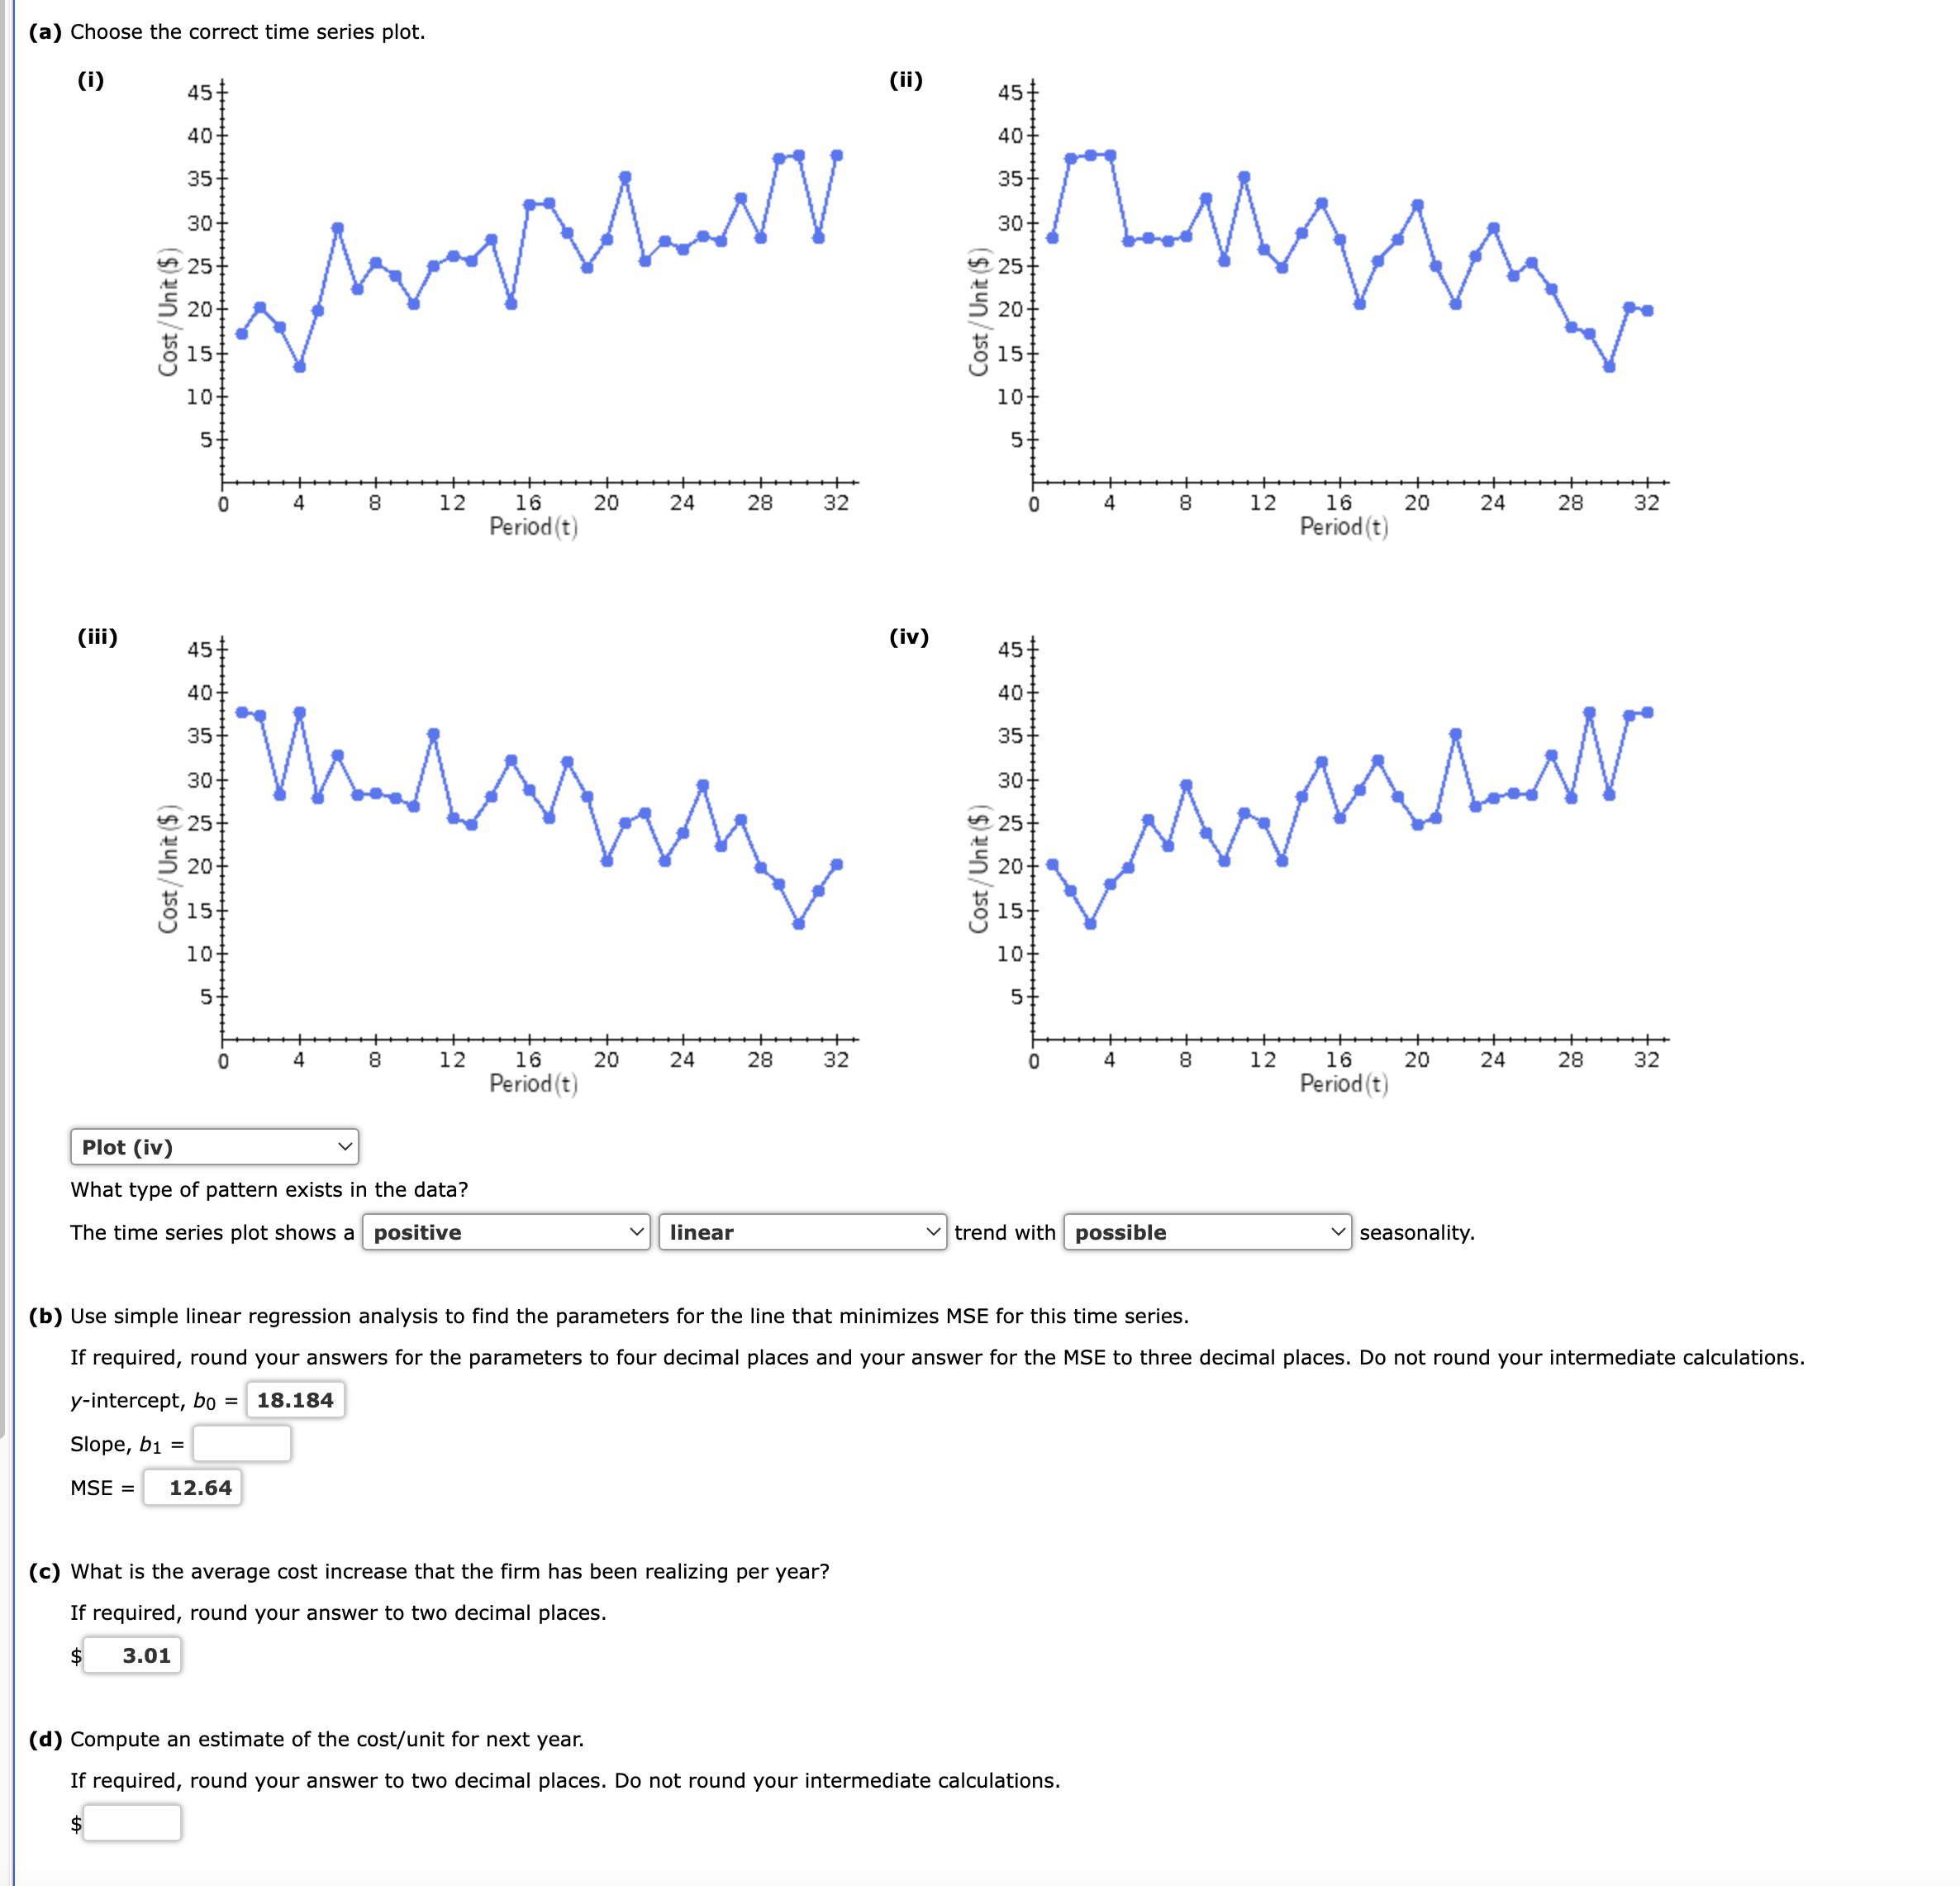
(a) Choose the correct time series plot. (i) 45 (iii) 40 35 WV 30 chmor fras 25 20 35 30 25 15 10- 5 45 40 0 35 30- 25 20 15. 10- 5 0 4 Slope, b = MSE = 12.64 8 4 12 8 12 Plot (iv) What type of pattern exists in the data? The time series plot shows a positive 16 Period (t) wwwww 20 16 Period (t) 24 20 24 28 linear 28 32 32 (ii) (c) What is the average cost increase that the firm has been realizing per year? If required, round your answer to two decimal places. 3.01 45 (iv) 40 15 10 5 45+ 40 35 30 25 0 20 15 10- 5 0 4 (d) Compute an estimate of the cost/unit for next year. If required, round your answer to two decimal places. Do not round your intermediate calculations. $ 4 trend with possible 00 8 12 8 16 Period (t) 12 www/w MAN 20 16 Period (t) 20 24 seasonality. 28 24 32 28 (b) Use simple linear regression analysis to find the parameters for the line that minimizes MSE for this time series. If required, round your answers for the parameters to four decimal places and your answer for the MSE to three decimal places. Do not round your intermediate calculations. y-intercept, bo 18.184 32
Step by Step Solution
There are 3 Steps involved in it
a The correct time series plot is iv The type of pattern tha... View full answer

Get step-by-step solutions from verified subject matter experts