

Question: A classic Statistics estimation problem stems from WWII, when the Allies wanted to estimate the number of German tanks manufactured each month by using serial
A classic Statistics estimation problem stems from WWII, when the Allies wanted to estimate the number of German tanks manufactured each month by using serial numbers.
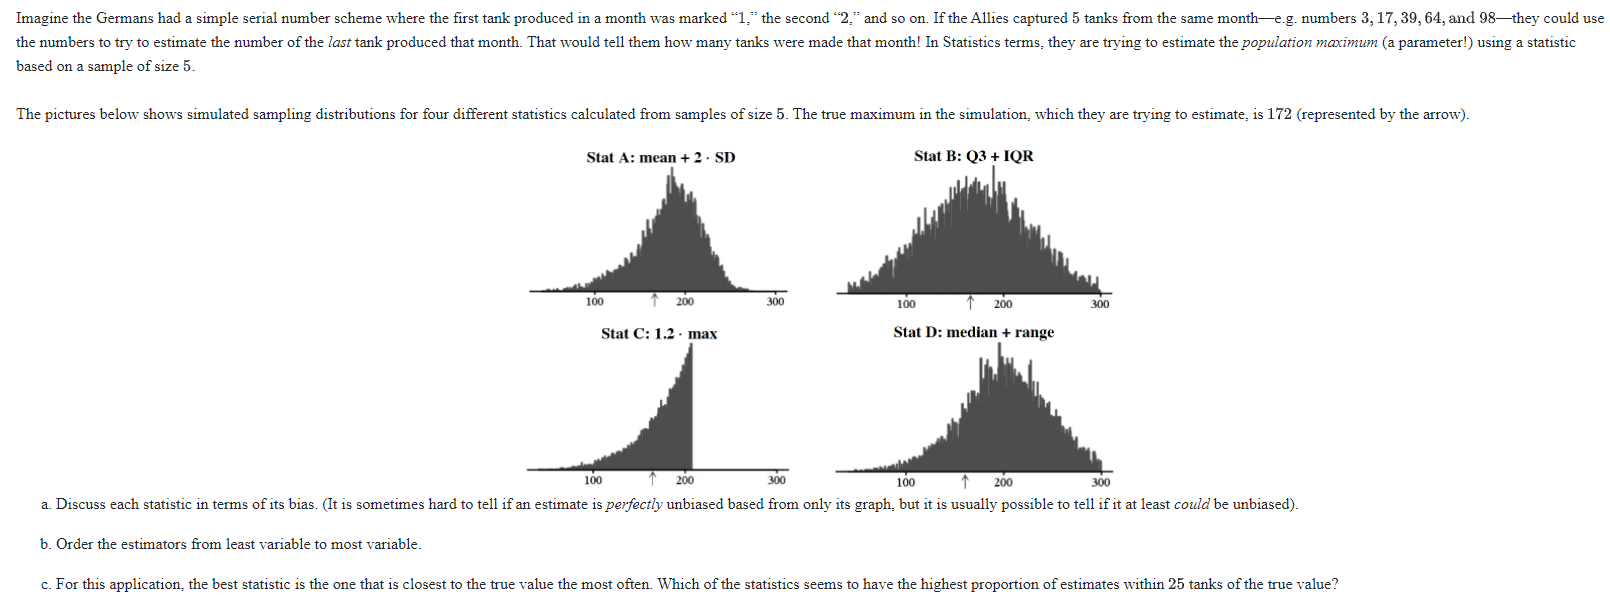
Imagine the Germans had a simple serial number scheme where the first tank produced in a month was marked "1," the second "2," and so on. If the Allies captured 5 tanks from the same month-e.g. numbers 3, 17, 39, 64, and 98-they could use the numbers to try to estimate the number of the last tank produced that month. That would tell them how many tanks were made that month! In Statistics terms, they are trying to estimate the population maximum (a parameter!) using a statistic based on a sample of size 5. The pictures below shows simulated sampling distributions for four different statistics calculated from samples of size 5. The true maximum in the simulation, which they are trying to estimate, is 172 (represented by the arrow). Stat A: mean + 2 . SD Stat B: Q3 + IQR 100 200 300 100 200 300 Stat C: 1.2 . max Stat D: median + range 100 200 300 100 200 300 a. Discuss each statistic in terms of its bias. (It is sometimes hard to tell if an estimate is perfectly unbiased based from only its graph, but it is usually possible to tell if it at least could be unbiased). b. Order the estimators from least variable to most variable. c. For this application, the best statistic is the one that is closest to the true value the most often. Which of the statistics seems to have the highest proportion of estimates within 25 tanks of the true value
Step by Step Solution
There are 3 Steps involved in it

Get step-by-step solutions from verified subject matter experts