

Question: A comparative balance sheet and income statement is shown for Cruz, Inc. CRUZ, INC Comparative Balance Sheets December 31, 2017 2017 2016 Assets Cash Accounts
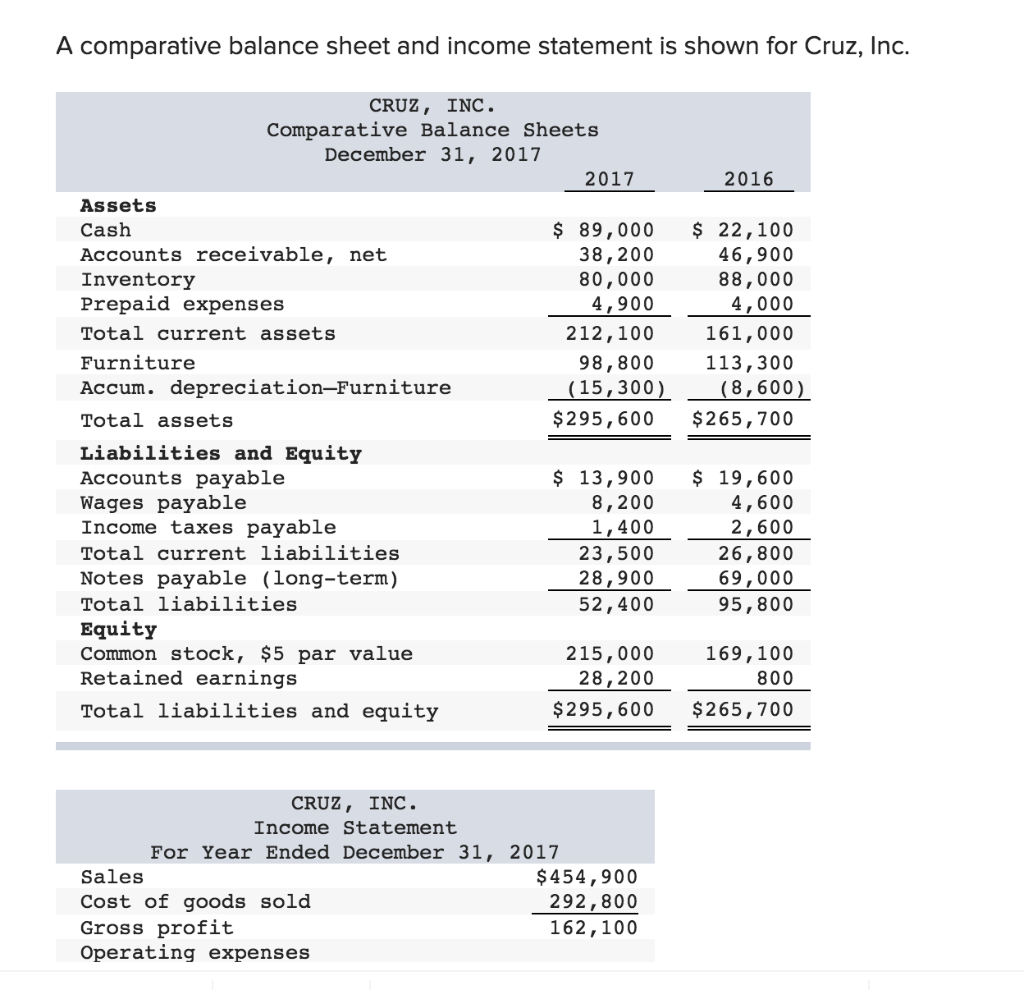
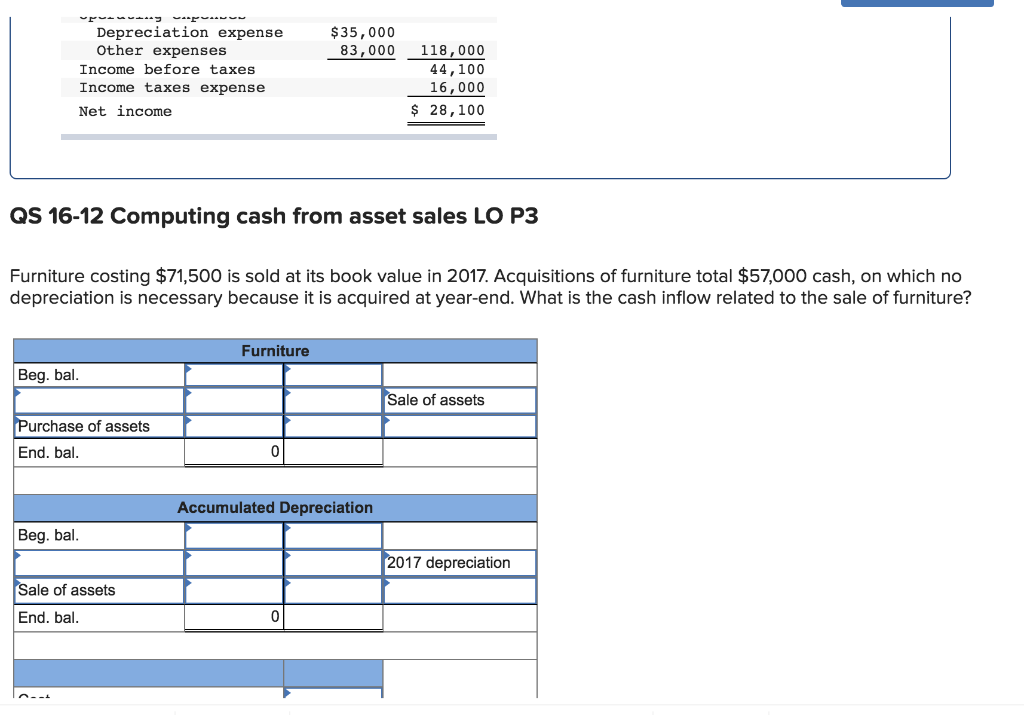
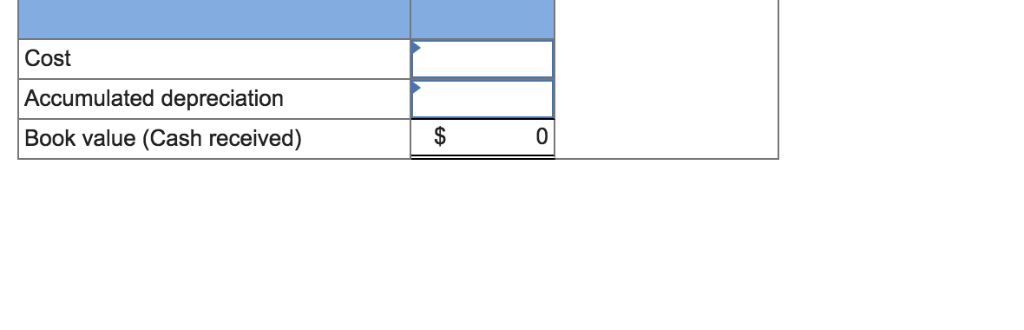
A comparative balance sheet and income statement is shown for Cruz, Inc. CRUZ, INC Comparative Balance Sheets December 31, 2017 2017 2016 Assets Cash Accounts receivable, net Inventory Prepaid expenses Total current assets Furniture Accum. depreciation-Furniture Total assets Liabilities and Equity Accounts payable Wages payable Income taxes payable Total current liabilities Notes payable (long-term) Total liabilities Equity Common stock, $5 par value Retained earnings Total liabilities and equity $ 89,000 22,100 46,900 88,000 4,000 161,000 113,300 (15,300) (8,600 $295,600 $265,700 38,200 80,000 4,900 212,100 98,800 $ 13,900 8,200 1,400 23,500 28,900 52,400 19,600 4,600 2,600 26,800 69,000 95,800 169,100 800 $295,600 265,700 215,000 28,200 CRUZ, INC Income Statement For Year Ended December 31, 2017 Sales Cost of goods sold Gross profit Operating expenses $454,900 292,800 162,100 Depreciation expense $35,000 Other expenses Income before taxes Income taxes expense Net income 83,000 118,000 44,100 16,000 $ 28,100 QS 16-12 Computing cash from asset sales LO P3 Furniture costing $71,500 is sold at its book value in 2017. Acquisitions of furniture total $57,000 cash, on which no depreciation is necessary because it is acquired at year-end. What is the cash inflow related to the sale of furniture? Furniture Beg. bal ale of assets urchase of assets End. bal Accumulated Depreciation Beg. bal 017 depreciation ale of assets End. bal Cost Accumulated depreciation Book value (Cash received) 0
Step by Step Solution
There are 3 Steps involved in it

Get step-by-step solutions from verified subject matter experts