

Question: A comparative balance sheet and income statement is shown for Cruz, Inc. CRUZ, INC. Comparative Balance Sheets December 31, 2017 2016 2017 Assets Cash Accounts
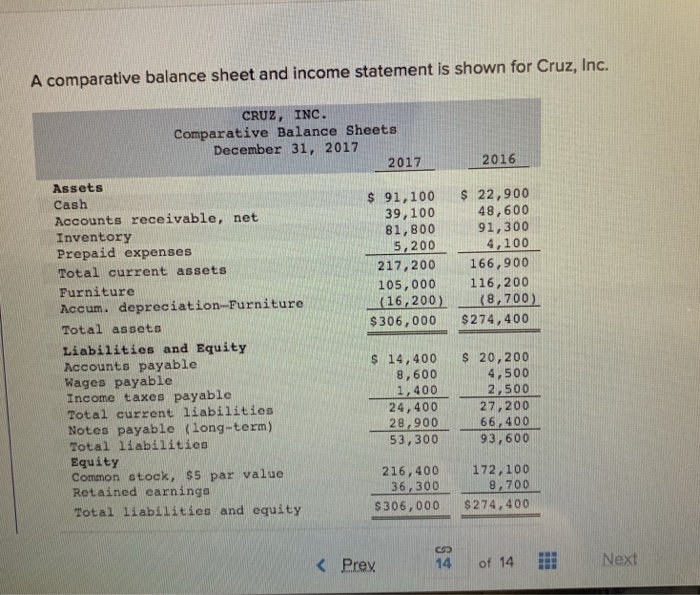
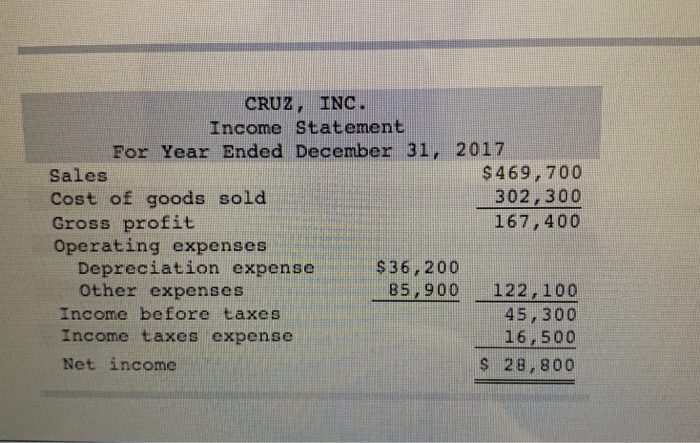
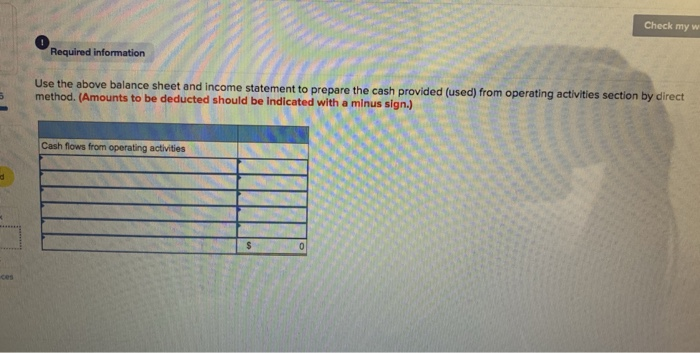
A comparative balance sheet and income statement is shown for Cruz, Inc. CRUZ, INC. Comparative Balance Sheets December 31, 2017 2016 2017 Assets Cash Accounts receivable, net s 91,100 22,900 48,600 91,300 4,100 217,200 166,900 105,000 116,200 39,100 81,800 5,200 Inventory Prepaid expenses Total current assets Furniture Accum. depreciation-Furniture Total assets Liabilities and Equity Accounts payable Wages payable Income taxes payable Total current liabilities Notes payable (long-term) Total liabilities Equity Common stock, $5 par value Retained earninga Total liabilities and equity (16.200) (8,700) $306,000 $274,400 s 14,400 s 20,200 4,500 2,500 27,200 66,400 93,600 8,600 1,400 24,400 28, 90066 400 53, 300 216,400172,100 36 3008,700 $306,000 $274, 400 K Prex14 of 14 Next CRUZ, INC Income Statement For Year Ended December 31, 2017 $469,700 302,300 167,400 Sales cost of goods sold Gross profit Operating expenses $36,200 Depreciation expense Other expenses Income before taxes Income taxes expense Net income 85,900 122, 100 45, 300 16,500 S 28,800 Check my w Required information ome statement to prepare the cash provided (used) from operating activities section by direct method. (Amounts to be deducted should be indicated with a minus sign.) Cash flows from operating activities
Step by Step Solution
There are 3 Steps involved in it

Get step-by-step solutions from verified subject matter experts