

Question: A comparative balance sheet and income statement is shown for Cruz, Inc. 2018 CRUZ, INC. Comparative Balance Sheets December 31, 2019 2019 Assets Cash $
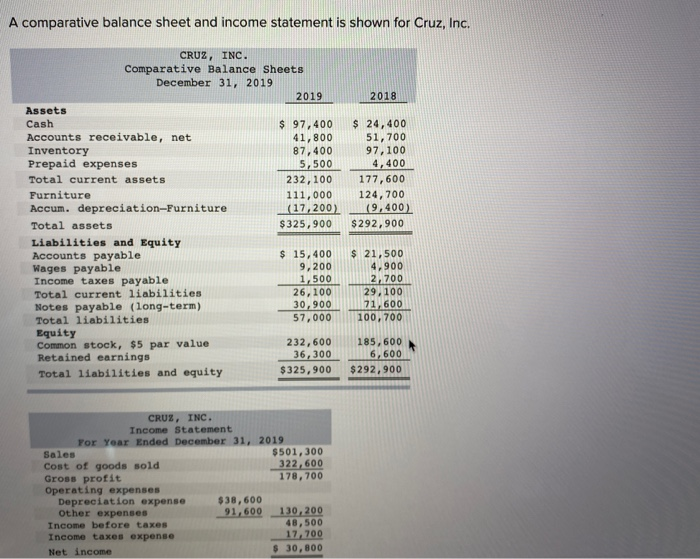
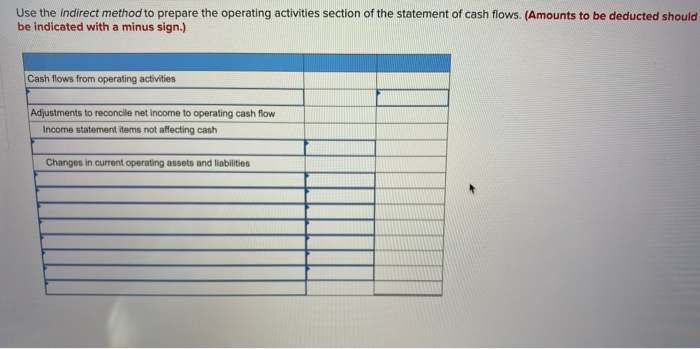
A comparative balance sheet and income statement is shown for Cruz, Inc. 2018 CRUZ, INC. Comparative Balance Sheets December 31, 2019 2019 Assets Cash $ 97,400 Accounts receivable, net 41,800 Inventory 87,400 Prepaid expenses 5,500 Total current assets 232, 100 Furniture 111,000 Accum. depreciation-Furniture (17,200) Total assets $325,900 Liabilities and Equity Accounts payable $ 15,400 Wages payable 9,200 Income taxes payable 1,500 Total current liabilities 26,100 Notes payable (long-term) 30,900 Total liabilities 57,000 Equity Common stock, $5 par value 232,600 Retained earnings 36,300 Total liabilities and equity $325, 900 $ 24,400 51,700 97,100 4,400 177,600 124,700 (9,400) $ 292,900 $ 21,500 4,900 2,700 29,100 71,600 100, 700 185,600 6,600 $292,900 CRUZ, INC. Income Statement For Year Ended December 31, 2019 Sales $501,300 Cost of goods sold 322,600 Gross profit 178,700 Operating expenses Depreciation expense $38,600 Other expenses 91,600 130,200 Income before taxes 48,500 Income taxes expense 17,700 Net income $ 30,800 Use the indirect method to prepare the operating activities section of the statement of cash flows. (Amounts to be deducted should be indicated with a minus sign.) Cash flows from operating activities Adjustments to reconcile net income to operating cash flow Income statement items not affecting cash Changes in current operating assets and liabilities
Step by Step Solution
There are 3 Steps involved in it

Get step-by-step solutions from verified subject matter experts