

Question: a. Compare the companies based on cash conversion cycle time, receivables turnover, inventory turnover, and asset turnover. Which company has the best operations and supply
a. Compare the companies based on cash conversion cycle time, receivables turnover, inventory turnover, and asset turnover. Which company has the best operations and supply chain processes? Which company is most efficient in its use of credit? Which company makes the best use of its facility and equipment assets?
b. What insights can you draw from your analysis? What could the companies learn from benchmarking each other?
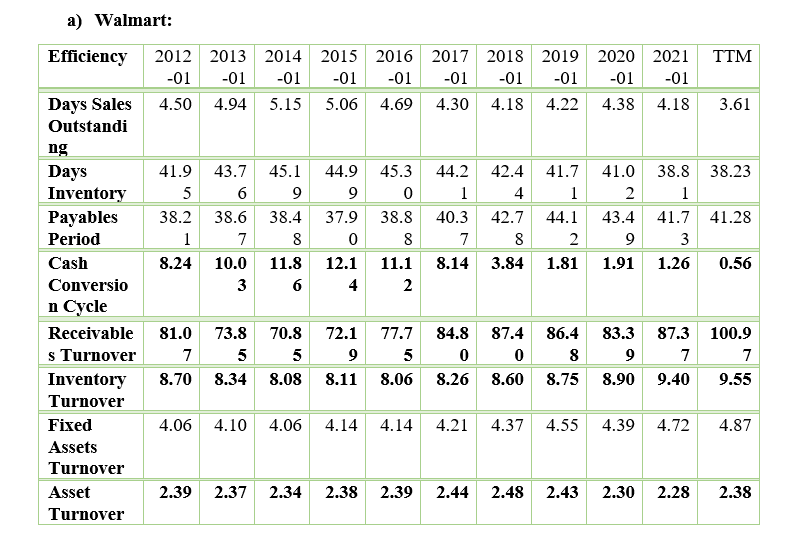
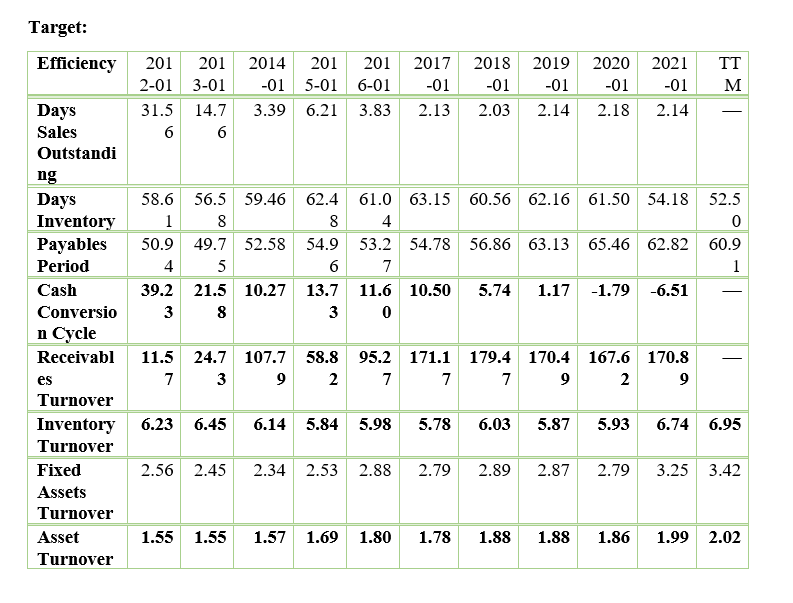
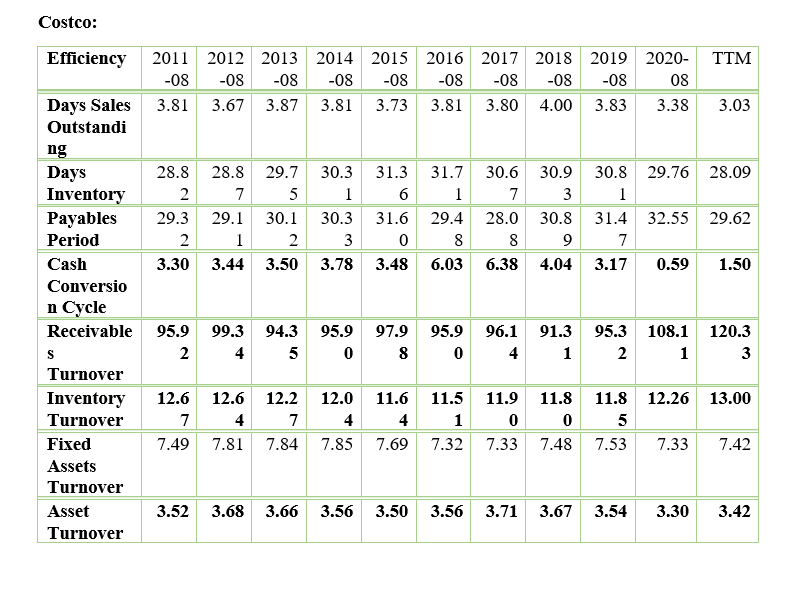
6 8 2 a) Walmart: Efficiency 2012 2013 2014 2015 2016 2017 2018 2019 2020 2021 TTM -01 -01 -01 -01 -01 -01 -01 -01 -01 -01 Days Sales 4.50 4.94 5.15 5.06 4.69 4.30 4.18 4.22 4.38 4.18 3.61 Outstandi ng Days 41.9 43.7 45.1 44.9 45.3 44.2 42.4 41.7 41.0 38.8 38.23 Inventory 5 6 9 9 0 1 4 1 2 1 Payables 38.2 38.6 38.4 37.9 38.8 40.3 42.7 44.1 43.4 41.7 41.28 Period 1 7 8 0 8 7 2 9 3 Cash 8.24 10.0 11.8 12.1 11.1 8.14 3.84 1.81 1.91 1.26 0.56 Conversio 6 4 2 n Cycle Receivable 81.0 73.8 70.8 72.1 77.7 84.8 87.4 86.4 83.3 87.3 100.9 s Turnover 7 5 5 9 5 0 0 8 9 7 7 Inventory 8.70 8.34 8.08 8.11 8.06 8.26 8.60 8.75 8.90 9.40 9.55 Turnover Fixed 4.06 4.10 4.06 4.14 4.14 4.21 4.37 4.55 4.39 4.72 4.87 Assets Turnover Asset 2.39 2.37 2.34 2.38 2.39 2.44 2.48 2.43 2.30 2.28 2.38 Turnover 3 2 5 Target: Efficiency 2019 2020 2014 201 -01 5-01 3.39 6.21 201 6-01 3.83 201 201 2-01 3-01 31.5 14.7 6 6 2017 -01 2.13 2018 -01 2.03 TT M -01 -01 2021 -01 2.14 2.14 2.18 Days Sales Outstandi ng 8 Days 58.6 56.5 59.46 62.4 61.0 63.15 60.56 62.16 61.50 54.18 52.5 Inventory 1 8 8 4 0 Payables 50.9 49.7 52.58 54.9 53.2 54.78 56.86 63.13 65.46 62.82 60.9 Period 4 5 6 7 1 Cash 39.2 21.5 10.27 13.7 11.6 10.50 5.74 1.17 -1.79 -6.51 Conversio 3 8 3 0 n Cycle Receivabl 11.5 24.7 107.7 58.8 95.2 171.1 179.4 170.4 167.6 170.8 es 7 3 9 2 7 7 7 9 2 9 Turnover Inventory 6.23 6.45 6.14 5.84 5.98 5.78 6.03 5.87 5.93 6.74 6.95 Turnover Fixed 2.56 2.45 2.34 2.53 2.88 2.79 2.89 2.87 2.79 3.25 3.42 Assets Turnover Asset 1.55 1.55 1.57 1.69 1.80 1.78 1.88 1.88 1.86 1.99 2.02 Turnover Costco: 8 8 Efficiency 2011 2012 2013 2014 2015 2016 2017 2018 2019 2020- TTM -08 -08 -08 -08 -08 -08 -08 -08 -08 08 Days Sales 3.81 3.67 3.87 3.81 3.73 3.81 3.80 4.00 3.83 3.38 3.03 Outstandi ng Days 28.8 28.8 29.7 30.3 31.3 31.7 30.6 30.9 30.8 29.76 28.09 Inventory 2 7 5 1 6 1 7 3 1 Payables 29.3 29.1 30.1 30.3 31.6 29.4 28.0 30.8 31.4 32.55 29.62 Period 2 1 2 3 0 8 8 9 7 Cash 3.30 3.44 3.50 3.78 3.48 6.03 6.38 4.04 3.17 0.59 1.50 Conversio n Cycle Receivable 95.9 99.3 94.3 95.9 97.9 95.9 96.1 91.3 95.3 108.1 120.3 s 2 4 5 0 8 0 4 1 2 1 3 Turnover Inventory 12.6 12.6 12.2 12.0 11.6 11.5 11.9 11.8 11.8 12.26 13.00 Turnover 7 4 7 4 4 1 0 0 5 Fixed 7.49 7.81 7.84 7.85 7.69 7.32 7.33 7.48 7.53 7.33 7.42 Assets Turnover Asset 3.52 3.68 3.66 3.56 3.50 3.56 3.71 3.67 3.54 3.30 3.42 Turnover 5 1 1Step by Step Solution
There are 3 Steps involved in it
1 Expert Approved Answer
Step: 1 Unlock

Question Has Been Solved by an Expert!
Get step-by-step solutions from verified subject matter experts
Step: 2 Unlock
Step: 3 Unlock