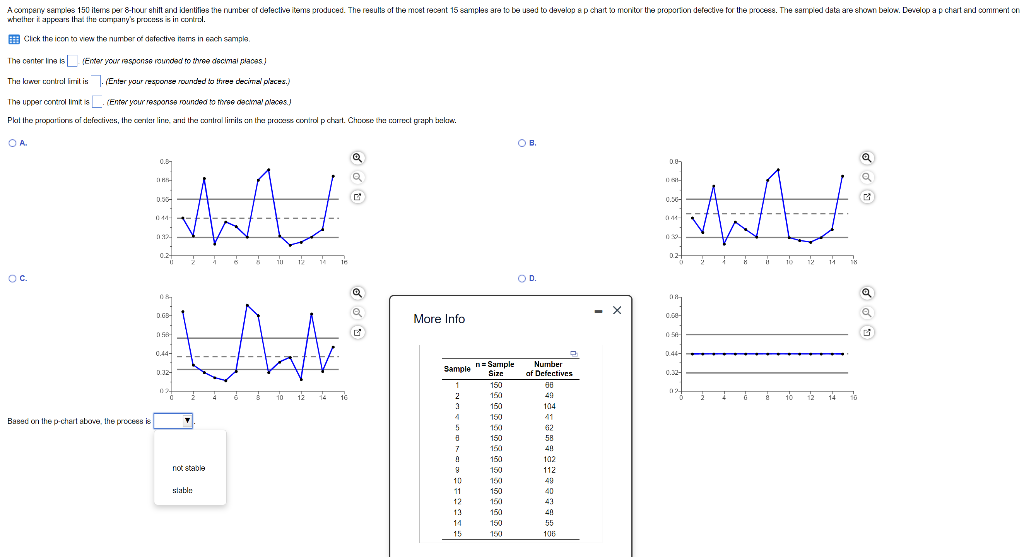
Question: A comperry Samples 150 iterie per 8-hour shift and identifies the number of defective items produced. The results of the most recent 15 samples are

A comperry Samples 150 iterie per 8-hour shift

A comperry Samples 150 iterie per 8-hour shift and identifies the number of defective items produced. The results of the most recent 15 samples are to be used to develop ap chat to monitor the proportion defective for the proceea. The sampled data are shown below. Develop a pchart and comment on whether it appears that the comgany's process is in control. Cick the icon to view the number or detective marrs in each sample The center insister your sponsorowded to three decal places! The kewer curtrollimitis (Enter your response rounded to three decimal places.) The upper controllints. (Enter your response rounded to live cemal places! . Pkit the proportions of defectives, the corner line, and the excital liris an the process control pchart. Choose the correct graph brakow. . . . @ 00 W 3 World 011 04 MA 132- 0.2 11 02 1 14 IH 10 12 14 A ht OC OD. Q a 08 X D G @ More Info 050 0.44- 0.44- 0.32- Sample h = Sample Number af Defectives 02 0 02 12 14 16 14 0 Based on the p-chart above, the procesi 1 2 3 4 5 8 7 9 8 10 11 12 13 11 15 n= Size 150 150 150 150 100 150 162 150 150 151 150 150 150 150 153 not stable 49 104 41 62 58 49 102 112 49 40 43 40 55 106 slable

Step by Step Solution

There are 3 Steps involved in it

1 Expert Approved Answer
Step: 1 Unlock blur-text-image
Question Has Been Solved by an Expert!

Get step-by-step solutions from verified subject matter experts

Step: 2 Unlock
Step: 3 Unlock

Students Have Also Explored These Related General Management Questions!