

Question: A. Complete the contingency table below by adding the color counts for the bag of Skittles you bought in the top row and computing the
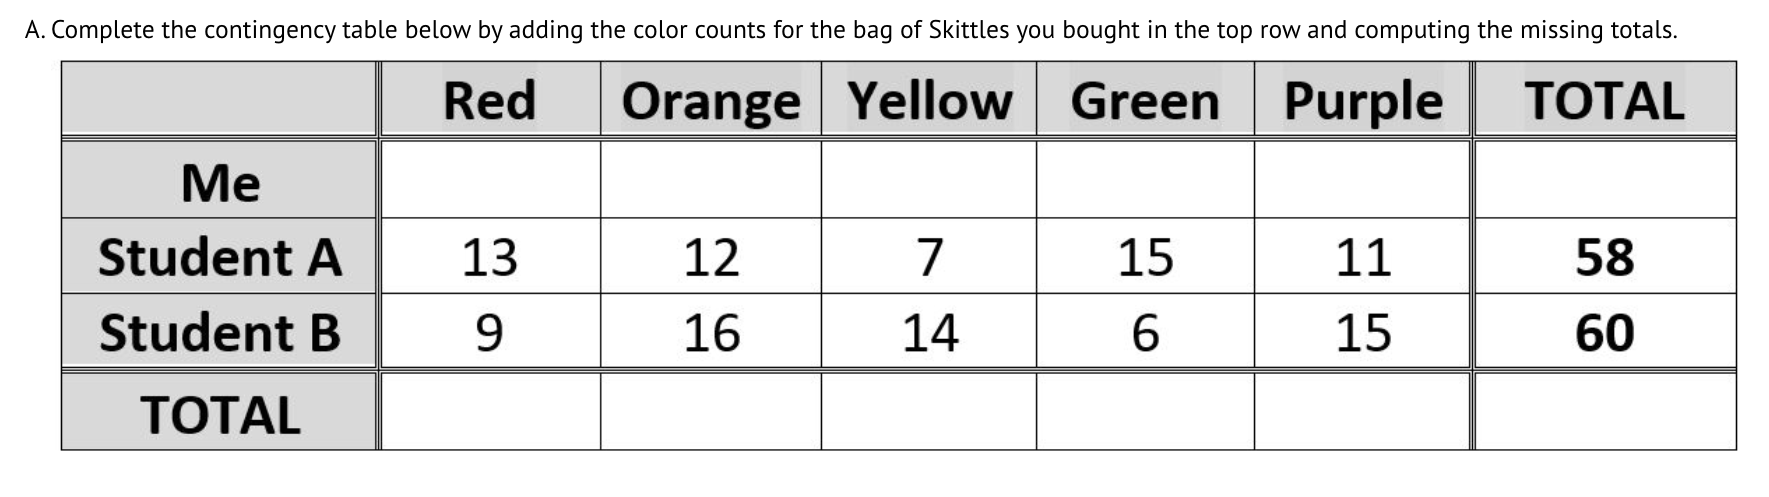
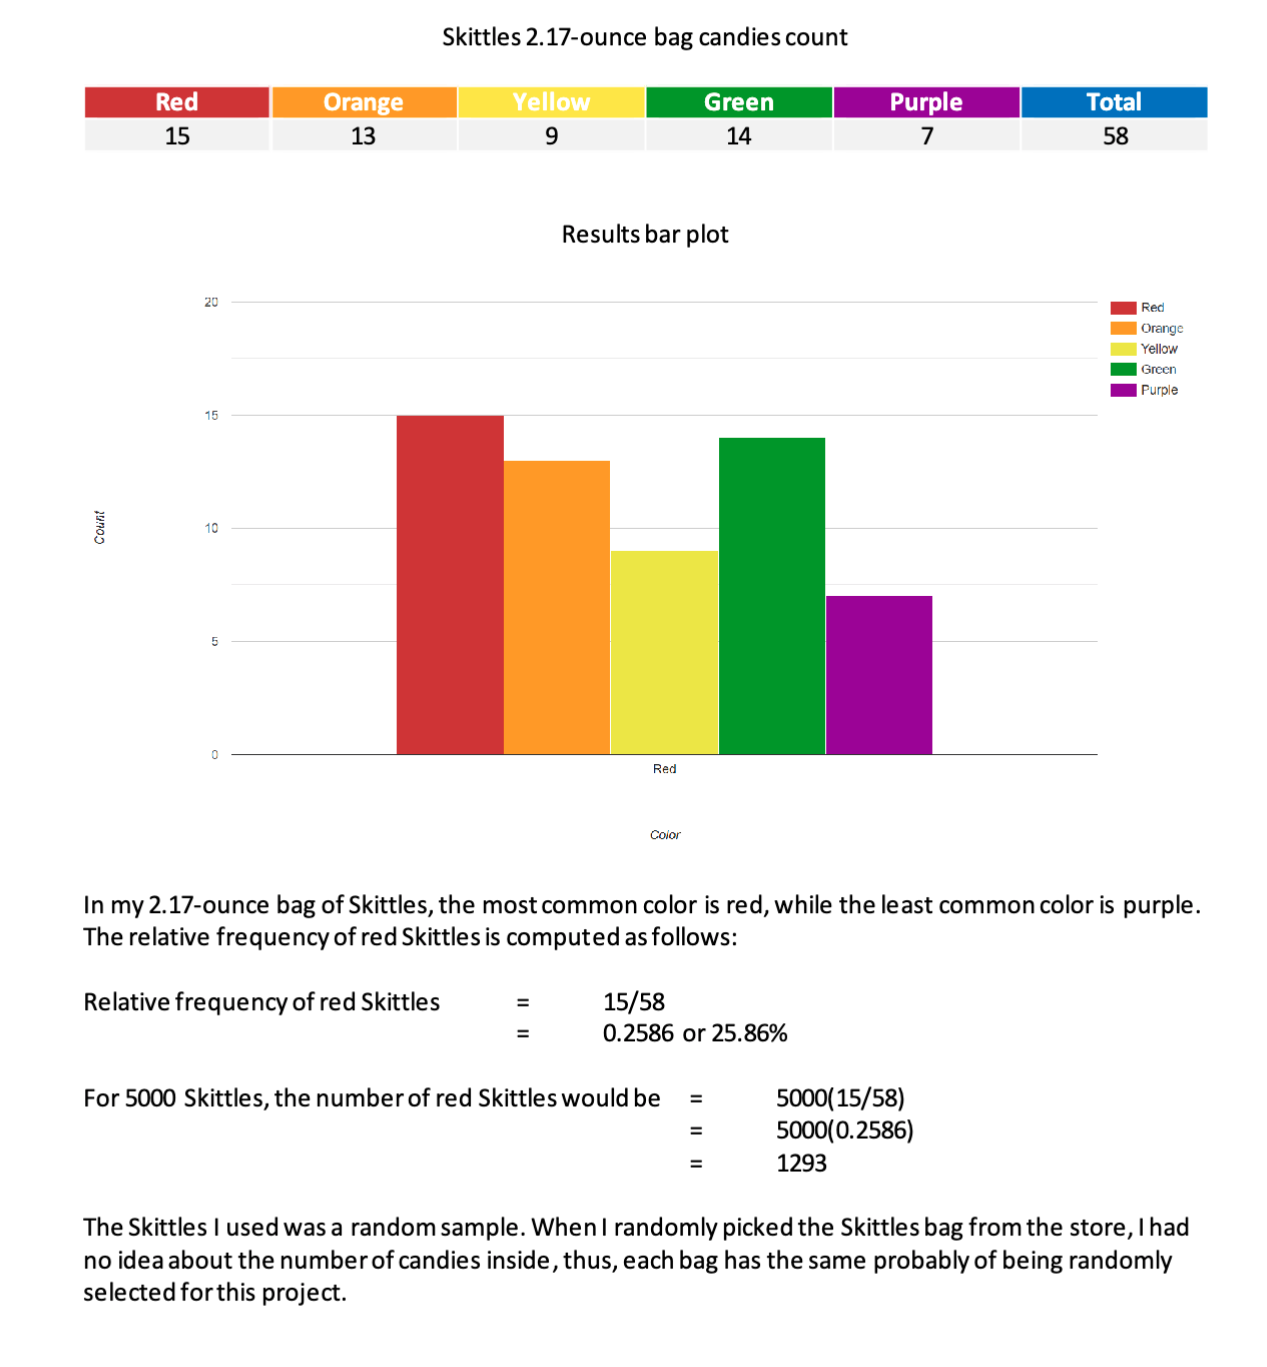
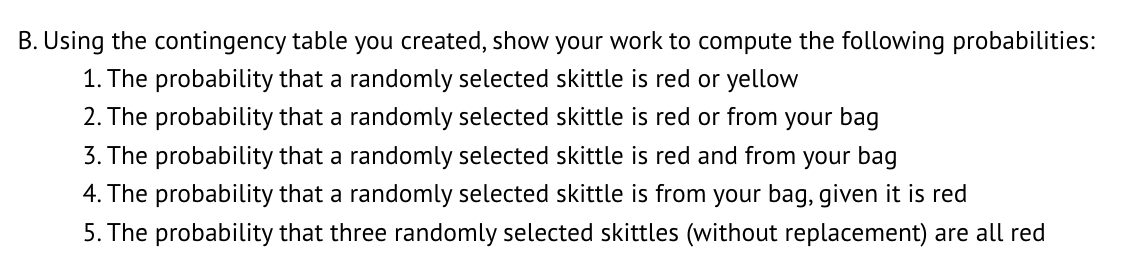
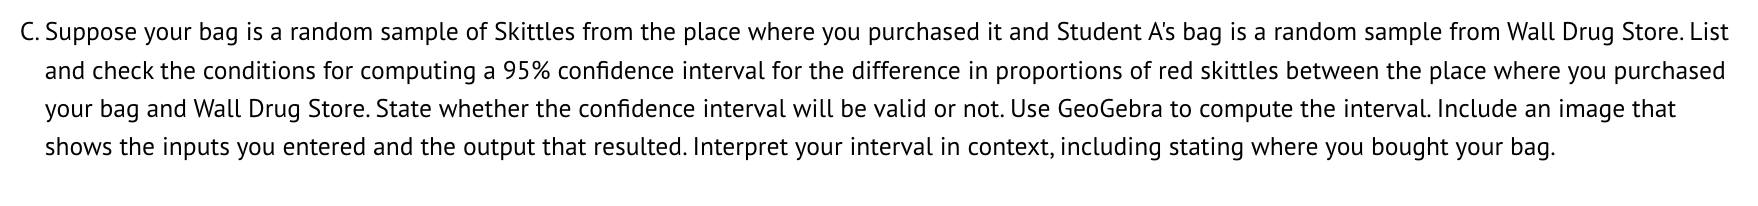

A. Complete the contingency table below by adding the color counts for the bag of Skittles you bought in the top row and computing the missing totals Red Orange Yellow Green Purple TOTAL Me Student A 58 Student B TOTAL 60 Skittles 2.17-ounce bag candies count Red Orange Yellow Green Purple Tota 15 13 9 14 58 Results bar plot 20 Red Orange Yellow Green Purple 15 Count 10 Red Color In my 2.17-ounce bag of Skittles, the most common color is red, while the least common color is purple. The relative frequency of red Skittles is computed as follows: Relative frequency of red Skittles 15/58 0.2586 or 25.86% For 5000 Skittles, the number of red Skittles would be 5000(15/58) 1 11 5000(0.2586) 1293 The Skittles I used was a random sample. When I randomly picked the Skittles bag from the store, I had no idea about the number of candies inside, thus, each bag has the same probably of being randomly selected for this project.B. Using the contingency table you created, show your work to compute the following probabilities: 1. The probability that a randomly selected skittle is red or yellow 2.The probability that a randomly selected skittle is red or from your bag 3. The probability that a randomly selected skittle is red and from your bag 4. The probability that a randomly selected skittle is from your bag, given it is red 5. The probability that three randomly selected skittles (without replacement) are all red CA Suppose your bag is a random sample of Skittles from the place where you purchased it and Student A's bag is a random sample from Wall Drug Store. List and check the conditions for computing a 95% condence interval for the difference in proportions of red skittles between the place where you purchased your bag and Wall Drug Store. State whether the condence interval will be valid or not Use GeoGebra to compute the interval. Include an image that shows the inputs you entered and the output that resulted. Interpret your interval in context, including stating where you bought your bag. D. Calculate 1111?), H1 (1 * g3), 71215, and n2 (1 7 f2) and state whether the sample sizes in your bag and Student A's bag are large enough for a hypothesis test for the difference in proportions to be valid. Using the data from your bag and from Student A's bag, carry out a hypothesis test for whether there is a difference in the proportions of red skittles between the place where you purchased your bag and Wall Drug Store. Give the hypotheses,test statistic, p- value, decision about the null hypothesis, and appropriate conclusion in contextYou may use a signicance level a, of 0.1
Step by Step Solution
There are 3 Steps involved in it

Get step-by-step solutions from verified subject matter experts