

Question: (a) Complete the following table and draw the corresponding graphs. Capital Labor Total Average Marginal inputs inputs product product product 20 0 0 20 1
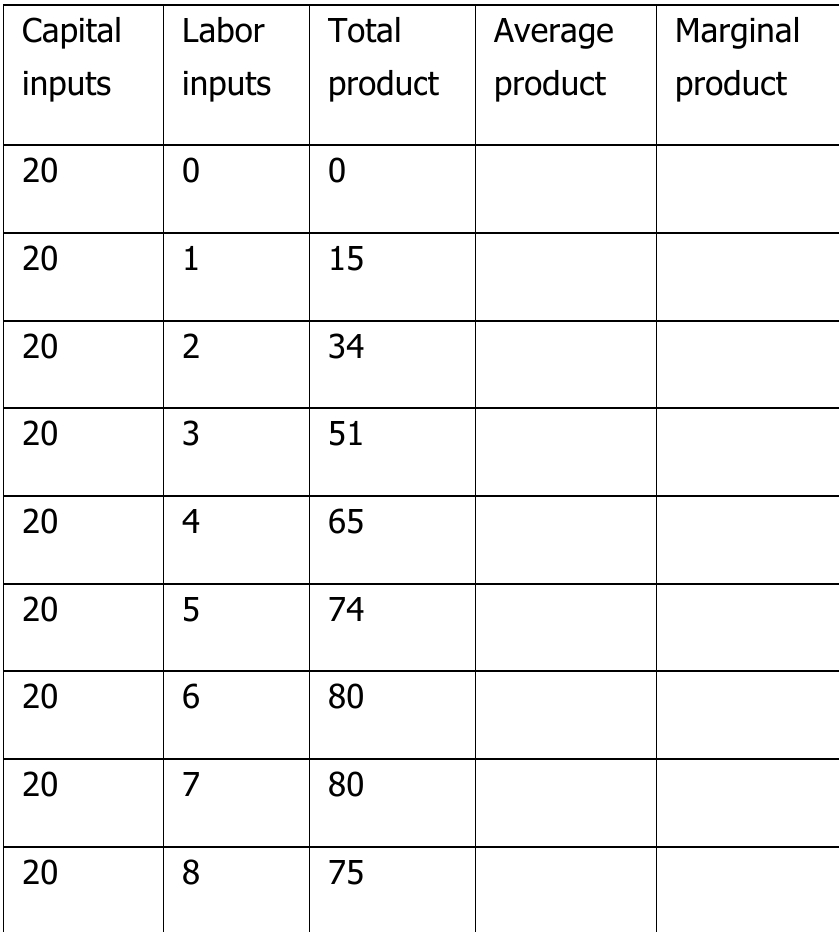
(a) Complete the following table and draw the corresponding graphs.

Capital Labor Total Average Marginal inputs inputs product product product 20 0 0 20 1 15 20 2 34 20 3 51 20 4 65 20 5 74 20 6 80 20 7 80 20 8 75
Step by Step Solution
There are 3 Steps involved in it
1 Expert Approved Answer
Step: 1 Unlock

Question Has Been Solved by an Expert!
Get step-by-step solutions from verified subject matter experts
Step: 2 Unlock
Step: 3 Unlock