

Question: a. Compute a three-period moving average forecast for weekly gas price. Report your forecast in a column. (2 points) b. Determine the regression line for
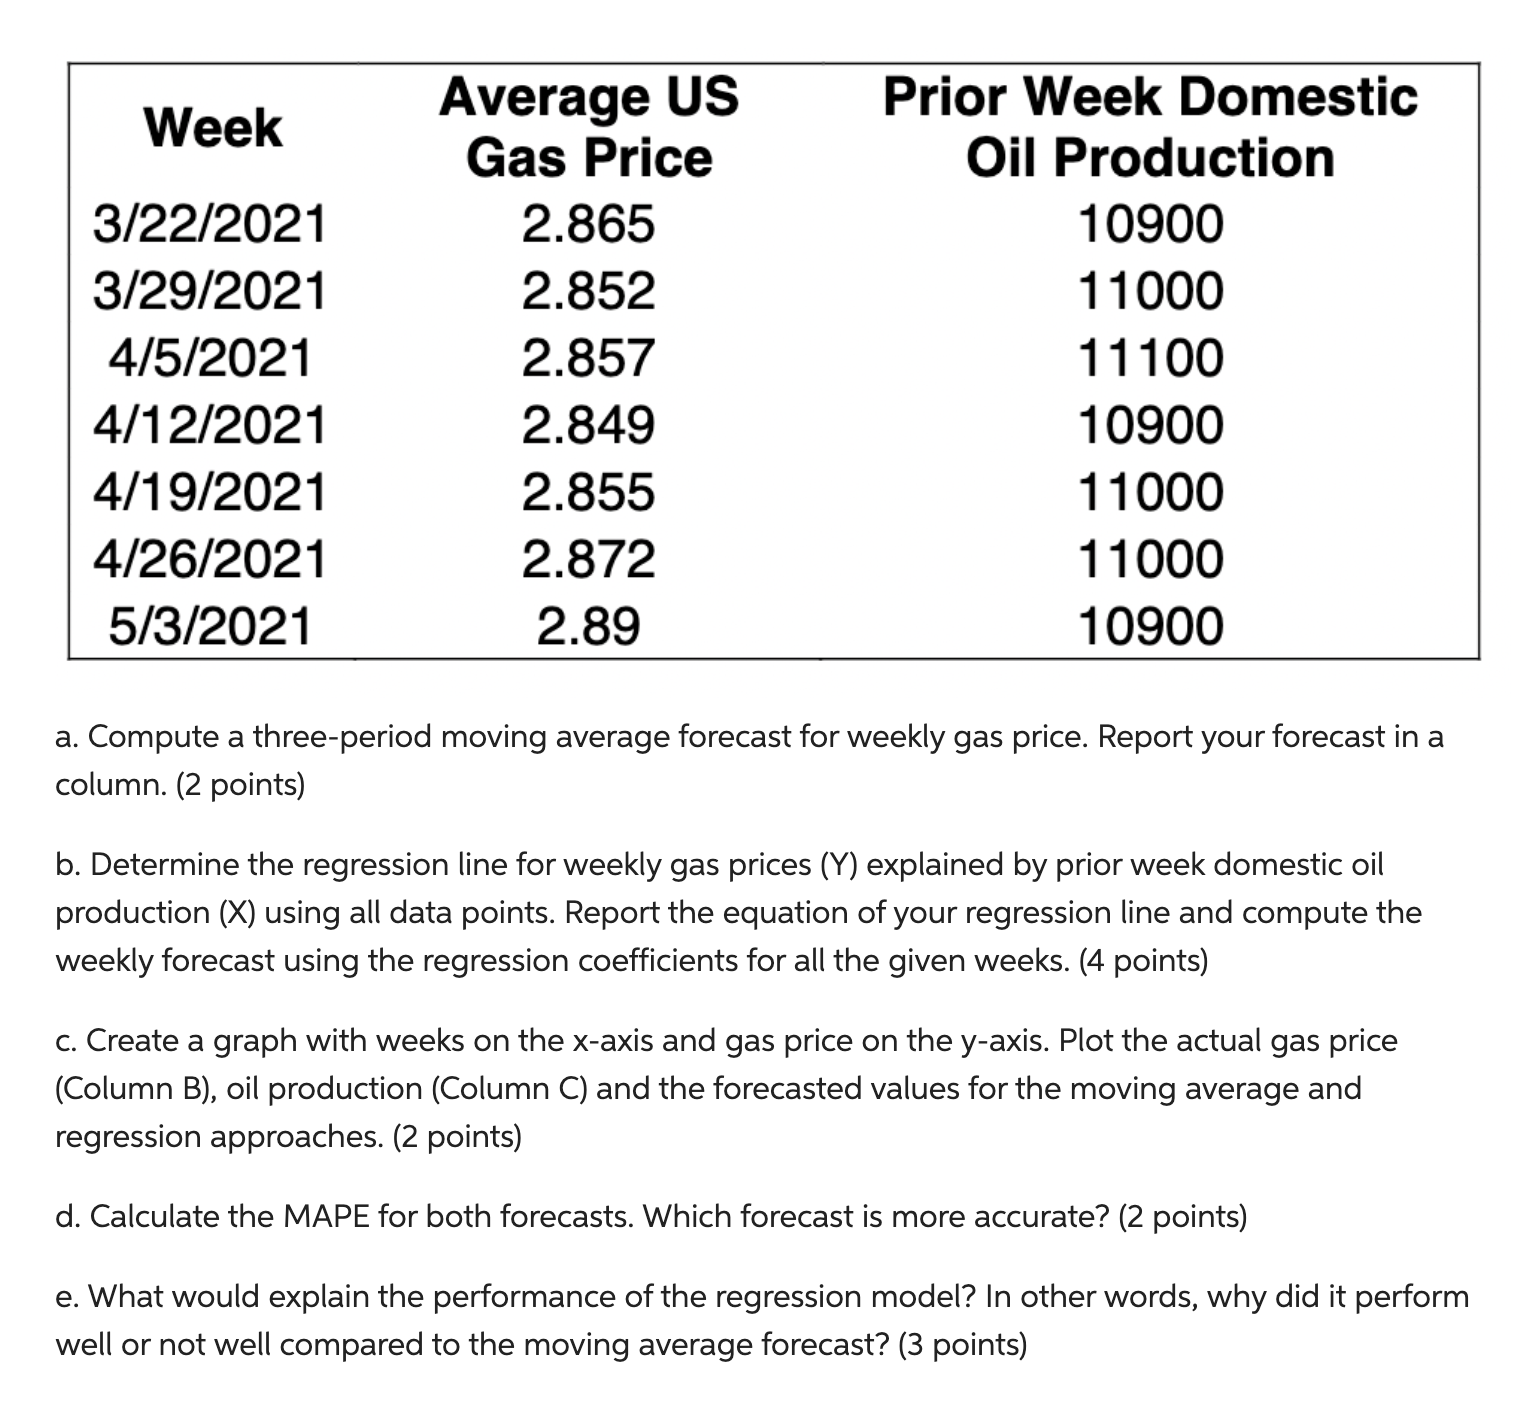
a. Compute a three-period moving average forecast for weekly gas price. Report your forecast in a column. (2 points) b. Determine the regression line for weekly gas prices (Y) explained by prior week domestic oil production (X) using all data points. Report the equation of your regression line and compute the weekly forecast using the regression coefficients for all the given weeks. (4 points) c. Create a graph with weeks on the x-axis and gas price on the y-axis. Plot the actual gas price (Column B), oil production (Column C) and the forecasted values for the moving average and regression approaches. (2 points) d. Calculate the MAPE for both forecasts. Which forecast is more accurate? (2 points) e. What would explain the performance of the regression model? In other words, why did it perform well or not well compared to the moving average forecast? (3 points) a. Compute a three-period moving average forecast for weekly gas price. Report your forecast in a column. (2 points) b. Determine the regression line for weekly gas prices (Y) explained by prior week domestic oil production (X) using all data points. Report the equation of your regression line and compute the weekly forecast using the regression coefficients for all the given weeks. (4 points) c. Create a graph with weeks on the x-axis and gas price on the y-axis. Plot the actual gas price (Column B), oil production (Column C) and the forecasted values for the moving average and regression approaches. (2 points) d. Calculate the MAPE for both forecasts. Which forecast is more accurate? (2 points) e. What would explain the performance of the regression model? In other words, why did it perform well or not well compared to the moving average forecast? (3 points)
Step by Step Solution
There are 3 Steps involved in it

Get step-by-step solutions from verified subject matter experts