

Question: (a) Compute Lockheed Martin's current ratio and quick ratio for 2016 and 2015. (Round your answers to two decimal places.) 2016 current ratio = Answer
(a) Compute Lockheed Martin's current ratio and quick ratio for 2016 and 2015. (Round your answers to two decimal places.) 2016 current ratio = Answer
2015 current ratio = Answer
2016 quick ratio = Answer
2015 quick ratio = Answer
(b) Compute total liabilities-to-equity ratios and total debt-to-equity ratios for 2016 and 2015 . (Round your answers to two decimal places.) 2016 total liabilities-to-stockholders' equity = Answer
2015 total liabilities-to-stockholders' equity = Answer
2016 total debt-to-equity = Answer
2015 total debt-to-equity = Answer
(c) Compute times interest earned ratio, cash from operations to total debt ratio, and free operating cash flow to total debt ratios. (Round your answers to two decimal places.) 2016 times interest earned = Answer
2015 times interest earned = Answer
2016 cash from operations to total debt = Answer
2015 cash from operations to total debt = Answer
2016 free operating cash flow to total debt = Answer
2015 free operating cash flow to total debt = Answer
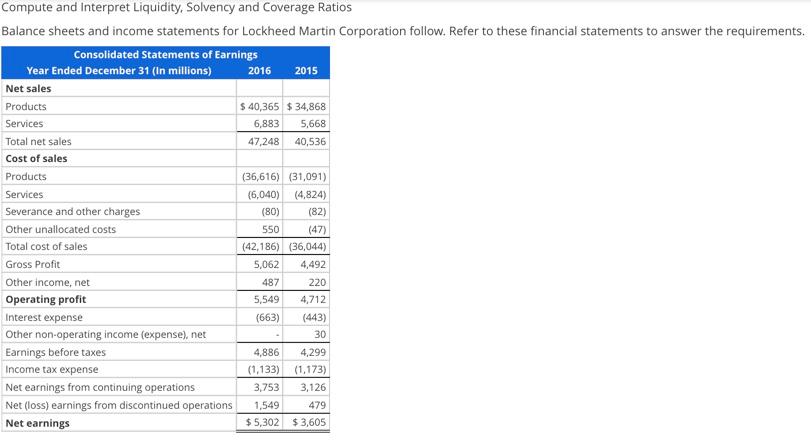
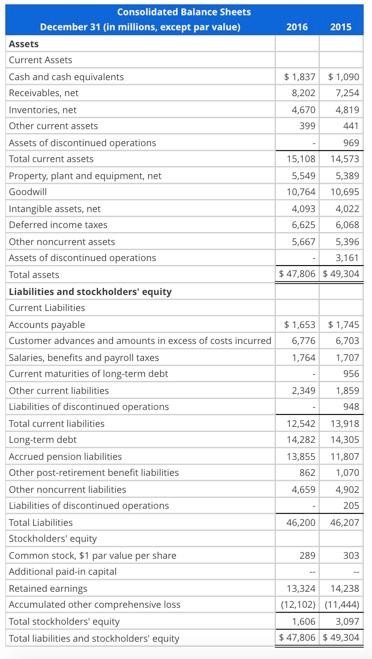
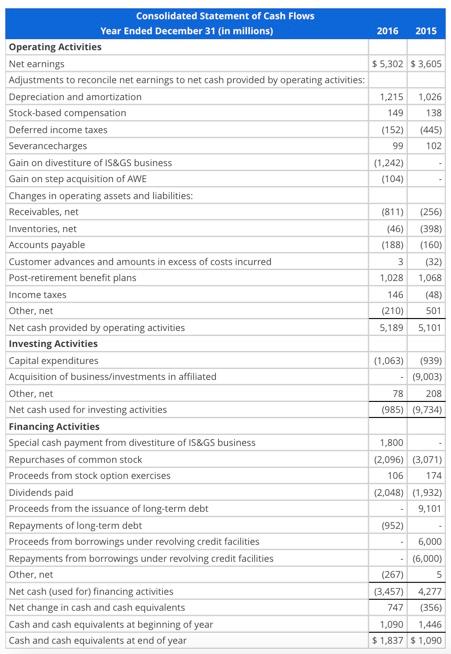
Compute and interpret Liquidity, Solvency and Coverage Ratios Balance sheets and income statements for Lockheed Martin Corporation follow. Refer to these financial statements to answer the requirements. Consolidated Statements of Earnings Year Ended December 31 (In millions) 2016 2015 Net sales Products $ 40,365 $34,868 Services 6,883 5,668 Total net sales 47,248 40,536 Cost of sales Products (36,616) (31,091) Services (6,040) (4,824) Severance and other charges (80) (82) Other unallocated costs (47) Total cost of sales (42,186) (36,044) Gross Profit 5,062 4,492 Other income, net 220 Operating profit 5,549 4,712 Interest expense (663) (443) Other non-operating income (expense), net 30 Earnings before taxes 4,886 4,299 Income tax expense (1,133) (1,173) Net earnings from continuing operations 3,753 3,126 Net (loss) earnings from discontinued operations 1,549 Net earnings $5,302 $3,605 550 487 479 2016 2015 $1,837 5 1,090 8,202 7.254 4,670 4,819 399 441 969 15,108 14,573 5,549 5,389 10,764 10,695 4,093 4,022 6,625 6,068 5,667 5,396 3,161 $ 47,806 $ 49,304 Consolidated Balance Sheets December 31 (in millions, except par value) Assets Current Assets Cash and cash equivalents Receivables, net Inventories, net Other current assets Assets of discontinued operations Total current assets Property, plant and equipment, net Goodwill Intangible assets, net Deferred income taxes Other noncurrent assets Assets of discontinued operations Total assets Liabilities and stockholders' equity Current Liabilities Accounts payable Customer advances and amounts in excess of costs incurred Salaries, benefits and payroll taxes Current maturities of long-term debt Other current liabilities Liabilities of discontinued operations Total current liabilities Long-term debt Accrued pension liabilities Other post-retirement benefit liabilities Other noncurrent liabilities Liabilities of discontinued operations Total Liabilities Stockholders' equity Common stock, $1 par value per share Additional paid-in capital Retained earnings Accumulated other comprehensive loss Total stockholders' equity Total liabilities and stockholders' equity $ 1,653 6,776 1.764 $ 1,745 6.703 1,707 956 2,349 12,542 14,282 13,855 862 4,659 1,859 948 13,918 14,305 11,807 1,070 4,902 205 46,200 46,207 289 303 13,324 14.238 (12,102) (11,444) 1,606 3,097 $ 47,806 $ 49,304 (32) Consolidated Statement of Cash Flows Year Ended December 31 (in millions) 2016 2015 Operating Activities Net earnings $5,302 $ 3,605 Adjustments to reconcile net earnings to net cash provided by operating activities: Depreciation and amortization 1.215 1,026 Stock-based compensation 149 138 Deferred income taxes (152) (445) Severancecharges 99 102 Gain on divestiture of S&GS business (1.242) Gain on step acquisition of AWE (104) Changes in operating assets and liabilities: Receivables, net (811) (256) Inventories, net (46) (398) Accounts payable (188) (160) Customer advances and amounts in excess of costs incurred 3 Post-retirement benefit plans 1,028 1,068 Income taxes 146 (48) Other, net (210) 501 Net cash provided by operating activities 5,189 5,101 Investing Activities Capital expenditures (1,063) (939) Acquisition of business/investments in affiliated - 19,003) Othernet 78 208 Net cash used for investing activities (985) (9.734) Financing Activities Special cash payment from divestiture of IS&G business 1,800 Repurchases of common stock (2,096) (3,071) Proceeds from stock option exercises 106 174 Dividends paid (2,048) (1.932) Proceeds from the issuance of long-term debt 9,101 Repayments of long-term debt (952) Proceeds from borrowings under revolving credit facilities 6,000 Repayments from borrowings under revolving credit facilities (6,000) Othernet (267) 5 Net cash (used for) financing activities 13,457) 4,277 Net change in cash and cash equivalents 747 (356) Cash and cash equivalents at beginning of year 1,090 1,446 Cash and cash equivalents at end of year $1,837 $ 1,090
Step by Step Solution
There are 3 Steps involved in it

Get step-by-step solutions from verified subject matter experts