

Question: A) Compute the efficient frontier for (1) the three markets (i.e. US, Europe, Japan) and (2) all the six markets considered. Assume that investors can
A) Compute the efficient frontier for (1) the three markets (i.e. US, Europe, Japan) and (2) all the six markets considered. Assume that investors can borrow and lend at the risk-free rate of interest and that they are able to take short positions. How does diversification into emerging markets affect the efficient set?
B) In the light of existing empirical evidence and your own findings, what are your recommendations?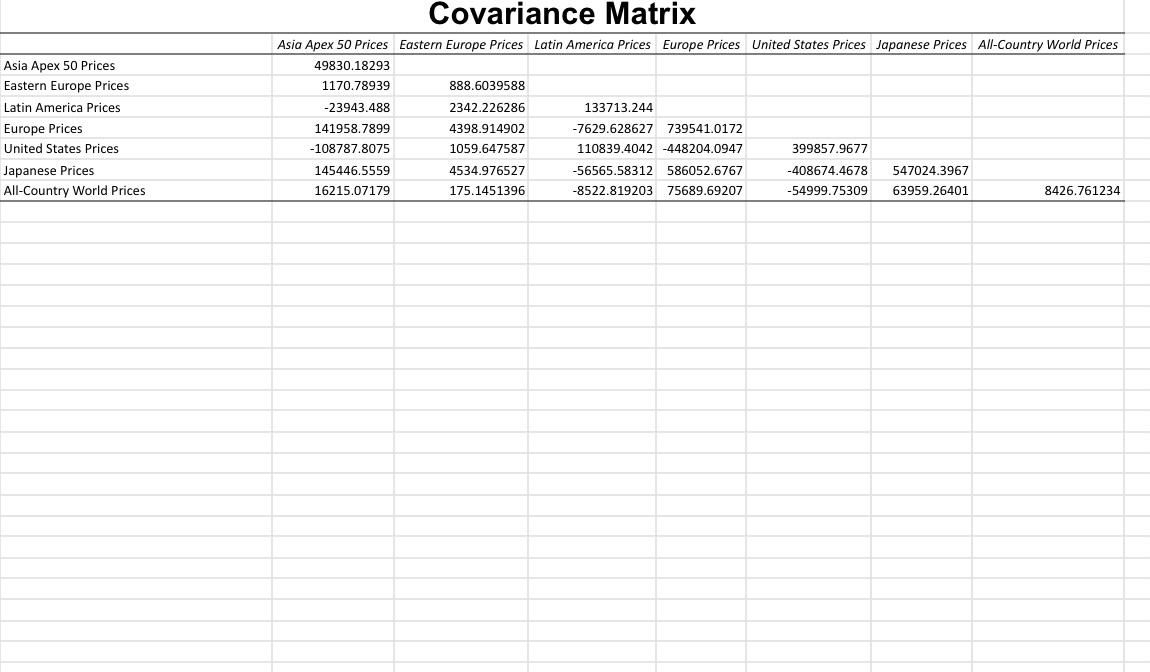
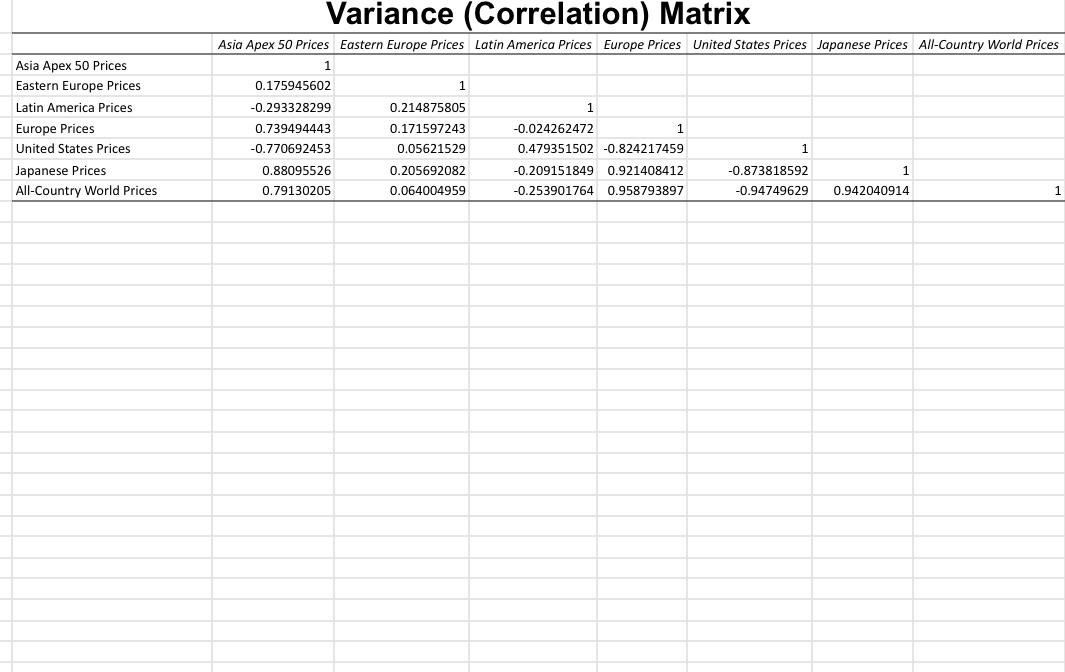
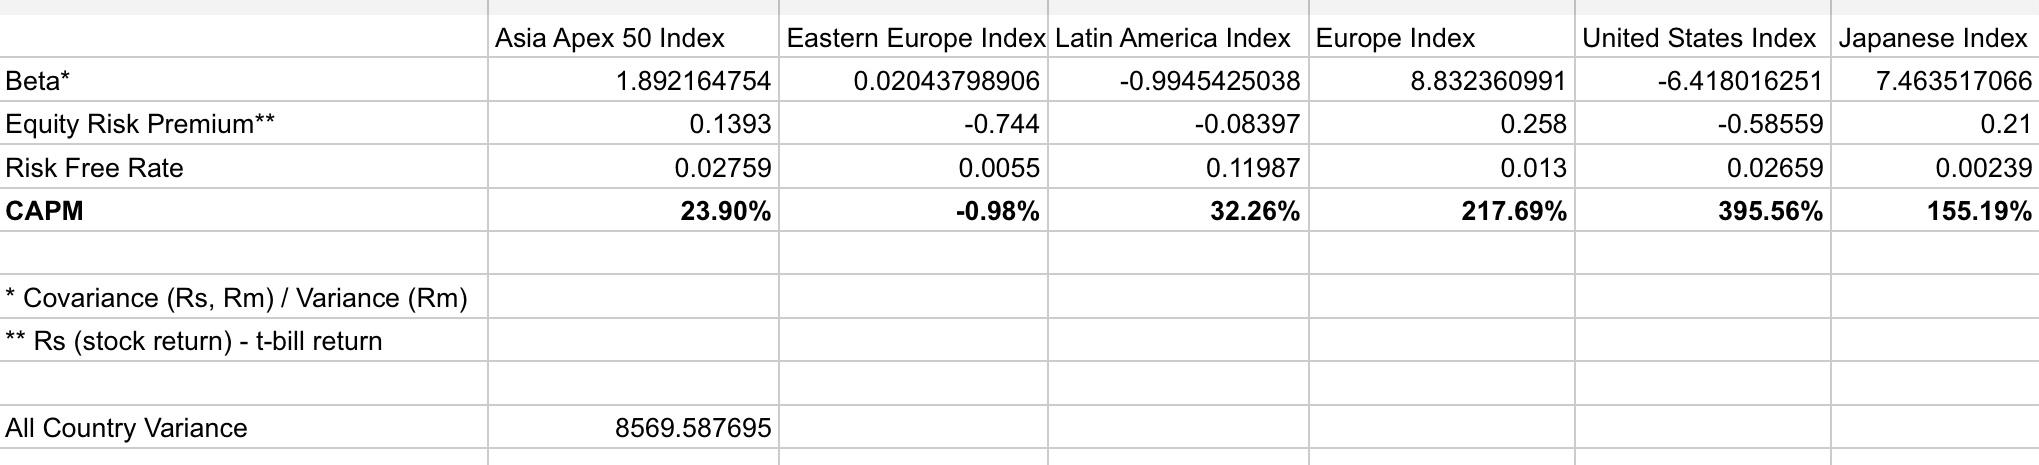
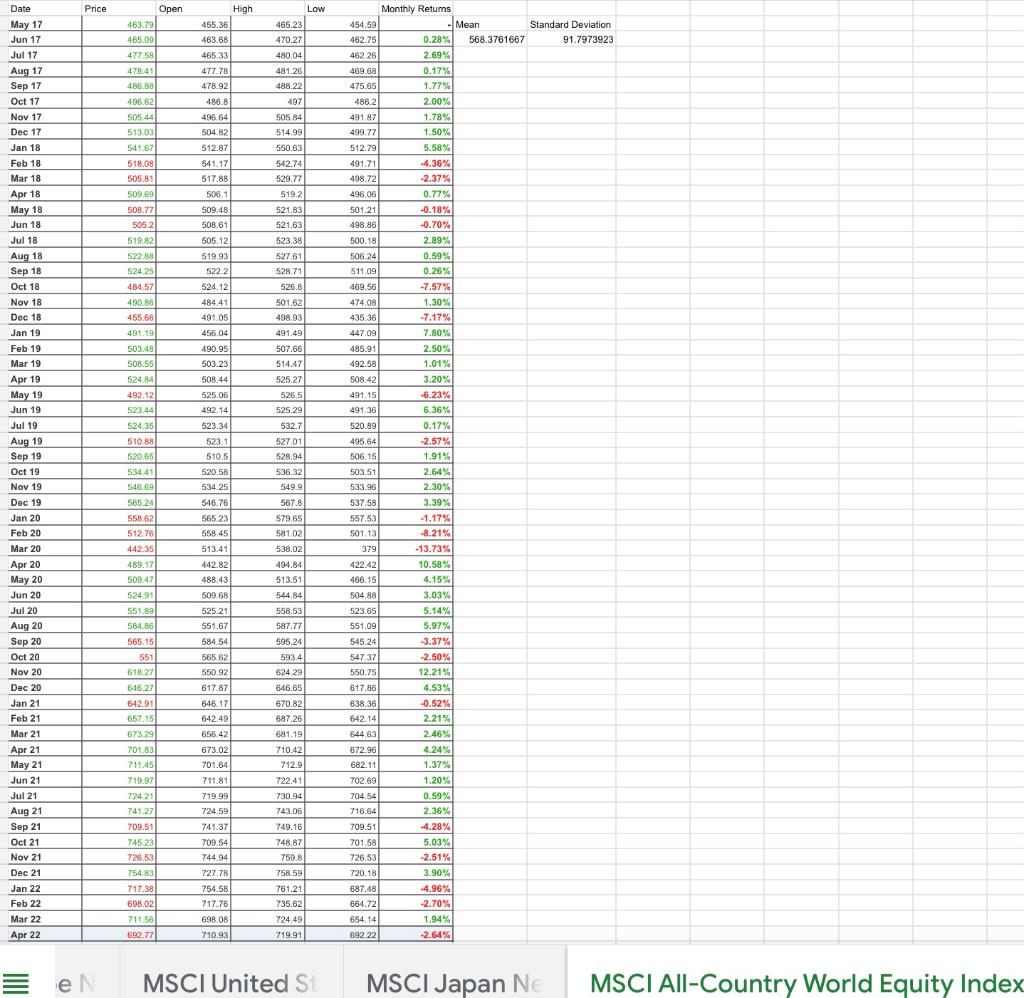
Covariance Matrix Asia Apex 50 Prices Eastern Europe Prices Latin America Prices Europe Prices United States Prices Japanese Prices All-Country World Prices Asia Apex 50 Prices Eastern Europe Prices Latin America Prices Europe Prices United States Prices Japanese Prices All-Country World Prices 49830.18293 1170.78939 888.6039588 -23943.488 2342.226286 133713.244 141958.7899 4398.914902 -7629.628627 739541.0172 -108787.8075 1059.647587 110839.4042 -448204.0947 399857.9677 145446.5559 4534.976527 -56565.58312 586052.6767 -408674.4678 547024.3967 16215.07179 175.1451396 -8522.819203 75689.69207 -54999.75309 63959.26401 8426.761234 Variance (Correlation) Matrix Asia Apex 50 Prices Eastern Europe Prices Latin America Prices Europe Prices United States Prices Japanese Prices All-Country World Prices Asia Apex 50 Prices Eastern Europe Prices Latin America Prices Europe Prices United States Prices Japanese Prices All-Country World Prices 1 0.175945602 1 -0.293328299 0.214875805 1 0.739494443 0.171597243 -0.024262472 1 -0.770692453 0.05621529 0.479351502 -0.824217459 0.88095526 0.205692082 -0.209151849 0.921408412 -0.873818592 1 0.79130205 0.064004959 -0.253901764 0.958793897 -0.94749629 0.942040914 1 Asia Apex 50 Index 1.892164754 United States Index Japanese Index -6.418016251 7.463517066 Beta* Eastern Europe Index Latin America Index Europe Index 0.02043798906 -0.9945425038 8.832360991 -0.744 -0.08397 0.258 0.1393 -0.58559 0.21 Equity Risk Premium** Risk Free Rate 0.02759 0.0055 0.11987 0.013 0.02659 0.00239 CAPM 23.90% -0.98% 32.26% 217.69% 395.56% 155.19% * Covariance (Rs, Rm) / Variance (Rm) Rs (stock return) - t-bill return ** All Country Variance 8569.587695 Price Open Low 463.79 454.59 462.75 462 26 Standard Deviation 91.7973923 465.23 470.27 480.04 481.26 488.22 497 469.68 475.65 High 455.36 463.68 465 33 477.78 478.92 486.8 496.64 504.82 512.87 541.17 517.88 506.1 465.09 477.58 478.41 486.88 496.62 505.44 513.03 541.67 518.09 505.81 509.69 486.2 505.84 514.99 491.87 499.77 Monthly Retums Mean 0.28% 568.3761667 2.69% 0.17% 1.77% 2.00% 1.78% 1.50% 5.58% -4.36% -2.37% 0.77% w -0.18% -0.70% 550.63 542.74 529.77 540 519.2 521.83 521.63 523.38 512.79 491.71 498.72 496 06 508.77 5052 501.21 498.86 500.18 2.8970 519.82 De 52288 524 25 484.57 490.86 455.68 491.19 503.48 508.55 524.84 509.48 508.61 505.12 519.93 5222 524.12 484.41 491.05 456.04 527.61 528.71 526.8 501.62 498.93 506.24 511.09 469.56 474.08 435.36 447.09 485.91 492.58 508.42 491.49 490.95 503.23 508.44 507.66 514.47 525.27 492.12 526.5 523.44 524.35 510.88 Date May 17 Jun 17 Jul 17 Aug 17 Sep 17 Oct 17 Nov 17 Dec 17 Jan 18 Feb 18 M. Mar 18 Apr 18 May 18 Jun 18 Jul 18 Aug 18 Sep 18 Oct 18 Nov 18 Dec 18 Jan 19 Feb 19 Mar 19 Apr 19 . May 19 Jun 19 Jul 19 Aug 19 Sep 19 Oct 19 Nov 19 Dec 19 20 Jan 20 Feb 20 Mar 20 Apr 20 May 20 Wildy 20 Jun 20 Jul 20 Aug 20 Sep 20 Oct 20 Nov 20 Dec 20 Jan 21 Feb 21 Mar24 Mar 21 Apr 21 Apr 23 May 21 Jun 21 Jul 21 Aug 21 Sep 21 Oct 21 Nov 21 Dec 21 Jan 22 Feb 22 Mar 22 Apr 22 525.06 492.141 42434 523.34 523.1 510.5 520.58 525.29 532.7 527.01 528.94 536.32 491.15 491.36 520.89 495.64 506.15 503.51 533.96 520.00 549.9 534.25 546.76 537.58 KEY 55753 501.13 379 379 534.41 546.69 Bee 565.24 558,62 512.76 442.35 489.17 500.47 524.911 551.89 584.88 565.15 567.8 ber 579.65 58102 538 02 338.02 494.84 513.51 310.5 544 84 www. 558.53 587.77 565.23 558.45 558.45 513.41 442.82 488.43 0 www 509,68 525.21 551.67 584.54 565.62 550.92 617.87 422421 466.15 504 B w 523.65 551.09 545.24 0.59% 0.26% Wac -7.57% 1.30% -7.17% 7.80% 2.50% 1.01% 3.20% -6.23% w 6.36% 0.17% -2.57% 1.91% 2.64% 2.30% 3.39% mod -1.17% -8.21% -13.73% 10.58% 4.15% 3.03% S. 5.14% Su 5.97% -3.37% -2.50% 12.21% 4.53% -0.52% 2.21% w 2.46% 4.24% 1.37% 1.20% 0.59% 0.02 2.36% SO 4.28% wa 5.03% -2.51% 3.90% -4.96% -2.70% 1.94% -2.64% 595.24 593.4 547 37 551 61827 52429 646.27 642.91 657.15 673.29 701.83 711.45 719.97 646.17 642.49 656.42 673.02 701.64 646.65 670.82 687.26 681,19 710.42 712.9 722.41 550.75 617.86 638.36 642.14 844.63 672.96 682.11 702.69 711.81 72421 741.27 719.99 724.59 741.37 709.54 744.94 727.78 754.58 717.76 730.94 743.06 749.16 748,87 759.8 709.51 745.23 726.53 754.83 717.38 698.02 711 692.72 704.54 716.64 - 709.51 701.58 726.53 720.18 687.48 664.72 654 14 692.22 758.59 761.21 735.62 724.49 719.91 698.08 710.93 eN MSCI United St MSCI Japan Ne MSCI All-Country World Equity Index - Covariance Matrix Asia Apex 50 Prices Eastern Europe Prices Latin America Prices Europe Prices United States Prices Japanese Prices All-Country World Prices Asia Apex 50 Prices Eastern Europe Prices Latin America Prices Europe Prices United States Prices Japanese Prices All-Country World Prices 49830.18293 1170.78939 888.6039588 -23943.488 2342.226286 133713.244 141958.7899 4398.914902 -7629.628627 739541.0172 -108787.8075 1059.647587 110839.4042 -448204.0947 399857.9677 145446.5559 4534.976527 -56565.58312 586052.6767 -408674.4678 547024.3967 16215.07179 175.1451396 -8522.819203 75689.69207 -54999.75309 63959.26401 8426.761234 Variance (Correlation) Matrix Asia Apex 50 Prices Eastern Europe Prices Latin America Prices Europe Prices United States Prices Japanese Prices All-Country World Prices Asia Apex 50 Prices Eastern Europe Prices Latin America Prices Europe Prices United States Prices Japanese Prices All-Country World Prices 1 0.175945602 1 -0.293328299 0.214875805 1 0.739494443 0.171597243 -0.024262472 1 -0.770692453 0.05621529 0.479351502 -0.824217459 0.88095526 0.205692082 -0.209151849 0.921408412 -0.873818592 1 0.79130205 0.064004959 -0.253901764 0.958793897 -0.94749629 0.942040914 1 Asia Apex 50 Index 1.892164754 United States Index Japanese Index -6.418016251 7.463517066 Beta* Eastern Europe Index Latin America Index Europe Index 0.02043798906 -0.9945425038 8.832360991 -0.744 -0.08397 0.258 0.1393 -0.58559 0.21 Equity Risk Premium** Risk Free Rate 0.02759 0.0055 0.11987 0.013 0.02659 0.00239 CAPM 23.90% -0.98% 32.26% 217.69% 395.56% 155.19% * Covariance (Rs, Rm) / Variance (Rm) Rs (stock return) - t-bill return ** All Country Variance 8569.587695 Price Open Low 463.79 454.59 462.75 462 26 Standard Deviation 91.7973923 465.23 470.27 480.04 481.26 488.22 497 469.68 475.65 High 455.36 463.68 465 33 477.78 478.92 486.8 496.64 504.82 512.87 541.17 517.88 506.1 465.09 477.58 478.41 486.88 496.62 505.44 513.03 541.67 518.09 505.81 509.69 486.2 505.84 514.99 491.87 499.77 Monthly Retums Mean 0.28% 568.3761667 2.69% 0.17% 1.77% 2.00% 1.78% 1.50% 5.58% -4.36% -2.37% 0.77% w -0.18% -0.70% 550.63 542.74 529.77 540 519.2 521.83 521.63 523.38 512.79 491.71 498.72 496 06 508.77 5052 501.21 498.86 500.18 2.8970 519.82 De 52288 524 25 484.57 490.86 455.68 491.19 503.48 508.55 524.84 509.48 508.61 505.12 519.93 5222 524.12 484.41 491.05 456.04 527.61 528.71 526.8 501.62 498.93 506.24 511.09 469.56 474.08 435.36 447.09 485.91 492.58 508.42 491.49 490.95 503.23 508.44 507.66 514.47 525.27 492.12 526.5 523.44 524.35 510.88 Date May 17 Jun 17 Jul 17 Aug 17 Sep 17 Oct 17 Nov 17 Dec 17 Jan 18 Feb 18 M. Mar 18 Apr 18 May 18 Jun 18 Jul 18 Aug 18 Sep 18 Oct 18 Nov 18 Dec 18 Jan 19 Feb 19 Mar 19 Apr 19 . May 19 Jun 19 Jul 19 Aug 19 Sep 19 Oct 19 Nov 19 Dec 19 20 Jan 20 Feb 20 Mar 20 Apr 20 May 20 Wildy 20 Jun 20 Jul 20 Aug 20 Sep 20 Oct 20 Nov 20 Dec 20 Jan 21 Feb 21 Mar24 Mar 21 Apr 21 Apr 23 May 21 Jun 21 Jul 21 Aug 21 Sep 21 Oct 21 Nov 21 Dec 21 Jan 22 Feb 22 Mar 22 Apr 22 525.06 492.141 42434 523.34 523.1 510.5 520.58 525.29 532.7 527.01 528.94 536.32 491.15 491.36 520.89 495.64 506.15 503.51 533.96 520.00 549.9 534.25 546.76 537.58 KEY 55753 501.13 379 379 534.41 546.69 Bee 565.24 558,62 512.76 442.35 489.17 500.47 524.911 551.89 584.88 565.15 567.8 ber 579.65 58102 538 02 338.02 494.84 513.51 310.5 544 84 www. 558.53 587.77 565.23 558.45 558.45 513.41 442.82 488.43 0 www 509,68 525.21 551.67 584.54 565.62 550.92 617.87 422421 466.15 504 B w 523.65 551.09 545.24 0.59% 0.26% Wac -7.57% 1.30% -7.17% 7.80% 2.50% 1.01% 3.20% -6.23% w 6.36% 0.17% -2.57% 1.91% 2.64% 2.30% 3.39% mod -1.17% -8.21% -13.73% 10.58% 4.15% 3.03% S. 5.14% Su 5.97% -3.37% -2.50% 12.21% 4.53% -0.52% 2.21% w 2.46% 4.24% 1.37% 1.20% 0.59% 0.02 2.36% SO 4.28% wa 5.03% -2.51% 3.90% -4.96% -2.70% 1.94% -2.64% 595.24 593.4 547 37 551 61827 52429 646.27 642.91 657.15 673.29 701.83 711.45 719.97 646.17 642.49 656.42 673.02 701.64 646.65 670.82 687.26 681,19 710.42 712.9 722.41 550.75 617.86 638.36 642.14 844.63 672.96 682.11 702.69 711.81 72421 741.27 719.99 724.59 741.37 709.54 744.94 727.78 754.58 717.76 730.94 743.06 749.16 748,87 759.8 709.51 745.23 726.53 754.83 717.38 698.02 711 692.72 704.54 716.64 - 709.51 701.58 726.53 720.18 687.48 664.72 654 14 692.22 758.59 761.21 735.62 724.49 719.91 698.08 710.93 eN MSCI United St MSCI Japan Ne MSCI All-Country World Equity Index
Step by Step Solution
There are 3 Steps involved in it

Get step-by-step solutions from verified subject matter experts