

Question: a) Compute the missing ratios (in yellow) for TTM: b) Based on PE ratios only, which company would you prefer to buy and why? Consider
 a) Compute the missing ratios (in yellow) for TTM:
 b) Based on PE ratios only, which company would you prefer to buy and why?
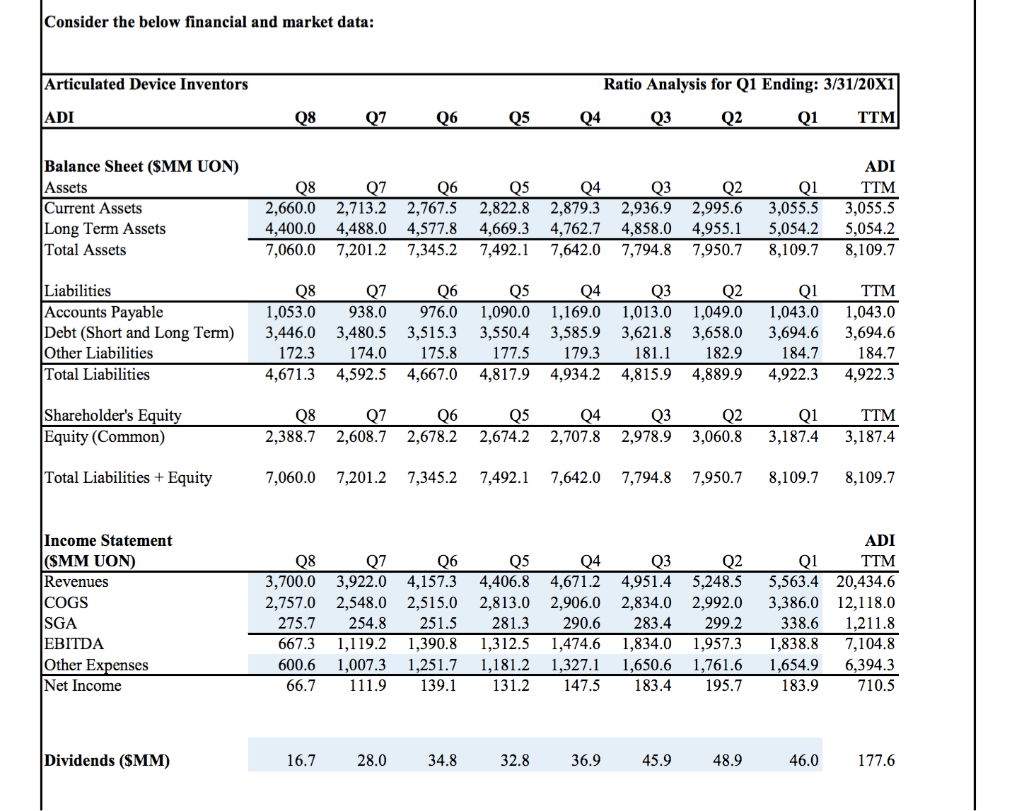
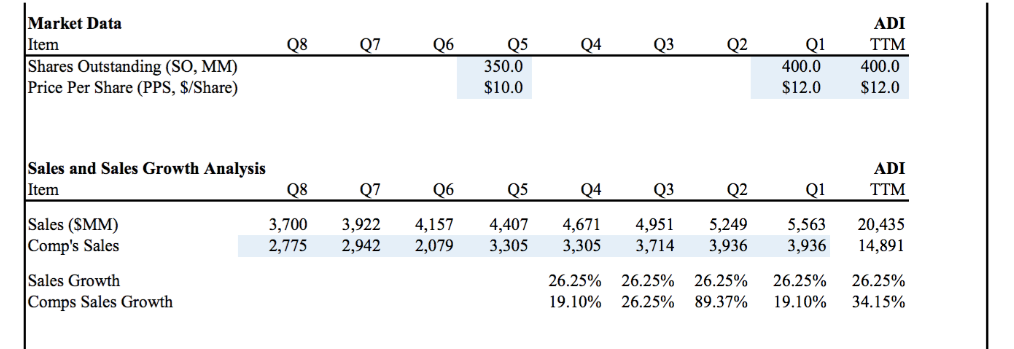
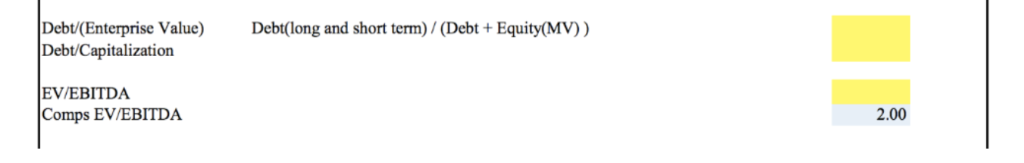
Consider the below financial and market data: Articulated Device Inventors Ratio Analysis for Q1 Ending: 3/31/20Xi ADI TTM Balance Sheet (SMM UON) Assets Current Assets Long Term Assets Total Assets ADI 2,660.0 2,713.2 2,767.5 2,822.8 2,879.3 2,936.9 2,995.6 3,055.53,055.5 4,400.0 4,488.0 4,577.8 4,669.3 4,762.7 4,858.0 4,955.15,054.25,054.2 7,060.0 7,201.2 7,345.2 7,492.1 7,642.0 7,794.87,950.78,109.78,109.7 Liabilities Accounts Payable Debt (Short and Long Term) 3,446.0 3,480.5 3,515.3 3,550.4 3,585.9 3,621.8 3,658.0 3,694.63,694.6 Other Liabilities Total Liabilities 1,053.0938.0 976.0 1,090.0 1,169.0 1,013.01,049.01,043.01,043.0 184.7 4,671.3 4,592.5 4,667.0 4,817.9 4,934.2 4,815.9 4,889.9 4,922.34,922.3 172.3 174.0175.8 177.5 179.3 1811 182.9 184.7 Shareholder's Equity (Common) Q2 2,388.7 2,608.72,678.2 2,674.2 2,707.8 2,978.9 3,060.8 3,187.43,187.4 Total Liabilities + Equity 7,060.0 7,201.2 7,345.2 7,492.1 7,642.0 7,794.8 7,950.7 8,109.78,109.7 Income Statement (SMM UON) Revenues COGS SGA EBITDA Other Expenses Net Income ADI Q1TTM 3,700.03,922.0 4,157.3 4,406.8 4,671.2 4,951.4 5,248.55,563.420,434.6 2,757.0 2,548.0 2,515.0 2,813.0 2,906.0 2,834.0 2,992.0 3,386.0 12,118.0 275.7 254.8 251.5 281.3 290.6 283.4 299.2 338.6211.8 667.3 1,119.2 1,390.8 1,312.51,474.6 1,834.0 1,957.31,838.8 7,104.8 600.6 1,007.31,251.71,181.2 1,327.1 1,650.61,761.6 1,654.96,394.3 183.9 710.5 Q4 Q2 66.7 111.9 139.1 131.2 147.5 183.4195.7 Dividends (SMM) 16.7 28.0 34.8 32.8 36.9 45.9 48.9 46.0 Debt/(Enterprise Valu Debt/Capitalization Debt(long and short term) (Debt +Equity(MV)) EV/EBITDA Comps EV/EBITDA 2.00 Consider the below financial and market data: Articulated Device Inventors Ratio Analysis for Q1 Ending: 3/31/20Xi ADI TTM Balance Sheet (SMM UON) Assets Current Assets Long Term Assets Total Assets ADI 2,660.0 2,713.2 2,767.5 2,822.8 2,879.3 2,936.9 2,995.6 3,055.53,055.5 4,400.0 4,488.0 4,577.8 4,669.3 4,762.7 4,858.0 4,955.15,054.25,054.2 7,060.0 7,201.2 7,345.2 7,492.1 7,642.0 7,794.87,950.78,109.78,109.7 Liabilities Accounts Payable Debt (Short and Long Term) 3,446.0 3,480.5 3,515.3 3,550.4 3,585.9 3,621.8 3,658.0 3,694.63,694.6 Other Liabilities Total Liabilities 1,053.0938.0 976.0 1,090.0 1,169.0 1,013.01,049.01,043.01,043.0 184.7 4,671.3 4,592.5 4,667.0 4,817.9 4,934.2 4,815.9 4,889.9 4,922.34,922.3 172.3 174.0175.8 177.5 179.3 1811 182.9 184.7 Shareholder's Equity (Common) Q2 2,388.7 2,608.72,678.2 2,674.2 2,707.8 2,978.9 3,060.8 3,187.43,187.4 Total Liabilities + Equity 7,060.0 7,201.2 7,345.2 7,492.1 7,642.0 7,794.8 7,950.7 8,109.78,109.7 Income Statement (SMM UON) Revenues COGS SGA EBITDA Other Expenses Net Income ADI Q1TTM 3,700.03,922.0 4,157.3 4,406.8 4,671.2 4,951.4 5,248.55,563.420,434.6 2,757.0 2,548.0 2,515.0 2,813.0 2,906.0 2,834.0 2,992.0 3,386.0 12,118.0 275.7 254.8 251.5 281.3 290.6 283.4 299.2 338.6211.8 667.3 1,119.2 1,390.8 1,312.51,474.6 1,834.0 1,957.31,838.8 7,104.8 600.6 1,007.31,251.71,181.2 1,327.1 1,650.61,761.6 1,654.96,394.3 183.9 710.5 Q4 Q2 66.7 111.9 139.1 131.2 147.5 183.4195.7 Dividends (SMM) 16.7 28.0 34.8 32.8 36.9 45.9 48.9 46.0 Debt/(Enterprise Valu Debt/Capitalization Debt(long and short term) (Debt +Equity(MV)) EV/EBITDA Comps EV/EBITDA 2.00
Step by Step Solution
There are 3 Steps involved in it

Get step-by-step solutions from verified subject matter experts