

Question: a. Compute the missing values in the following table.What economic relationship does the completed table illustrate? b. Draw an IS-LM figure with two IS curves,
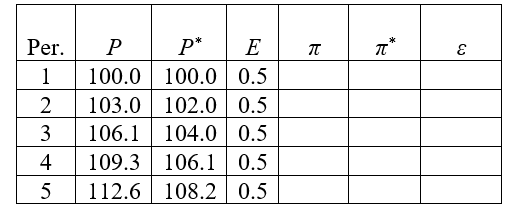
a. Compute the missing values in the following table.What economic relationship does the completed table illustrate?
b. Draw an IS-LM figure with two IS curves, one for period 1, and the other for period 5, and EXPLAIN INTUITIVELY (i.e., by economic relationships) why the IS curve for period 5 differs from that for period 1.
\f
Step by Step Solution
There are 3 Steps involved in it
1 Expert Approved Answer
Step: 1 Unlock

Question Has Been Solved by an Expert!
Get step-by-step solutions from verified subject matter experts
Step: 2 Unlock
Step: 3 Unlock