

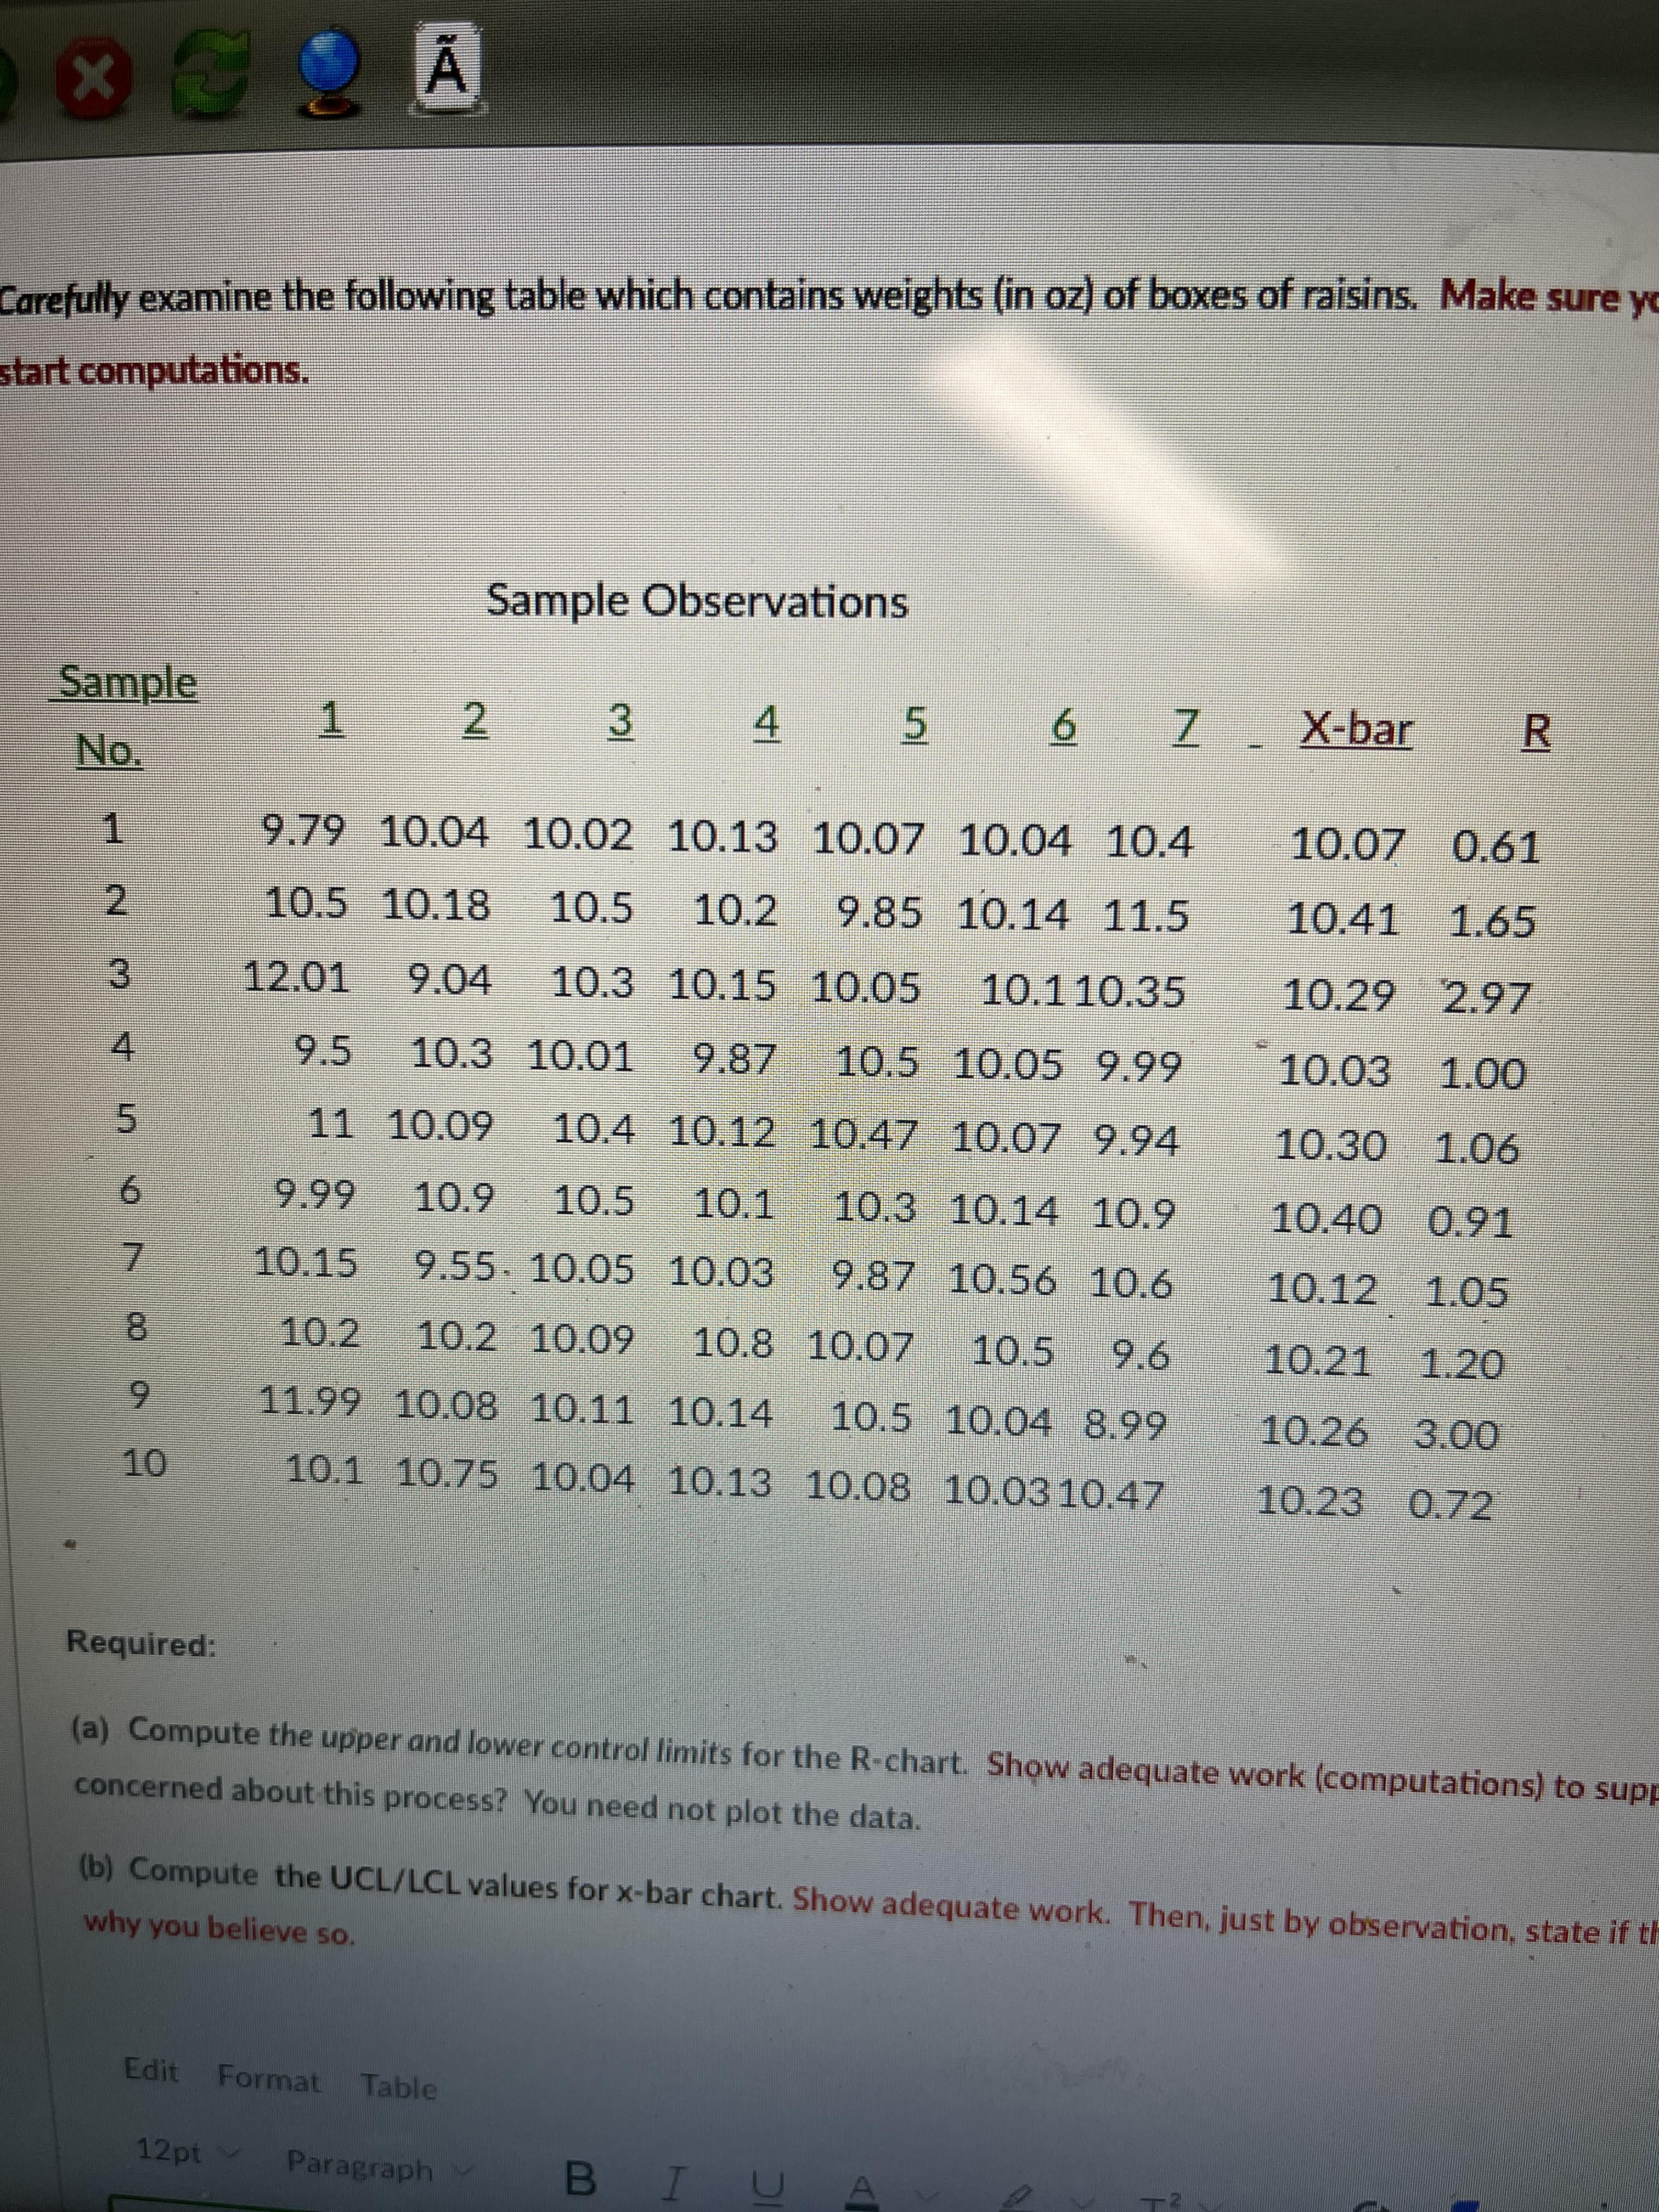
Question: a ) Compute the upper and lower control limits for the R Chart. Show adequate work ( computations ) to support your response. Is there
a Compute the upper and lower control limits for the R Chart. Show adequate work computations to support your response. Is there any reason to be concerned about this process? You need not plot the data.
b Compute the UCLLCL values for xbar chart. Show adequate work. Then, just by observation, state if the process appears to be in control and state why you believe so
Step by Step Solution
There are 3 Steps involved in it
1 Expert Approved Answer
Step: 1 Unlock

Question Has Been Solved by an Expert!
Get step-by-step solutions from verified subject matter experts
Step: 2 Unlock
Step: 3 Unlock