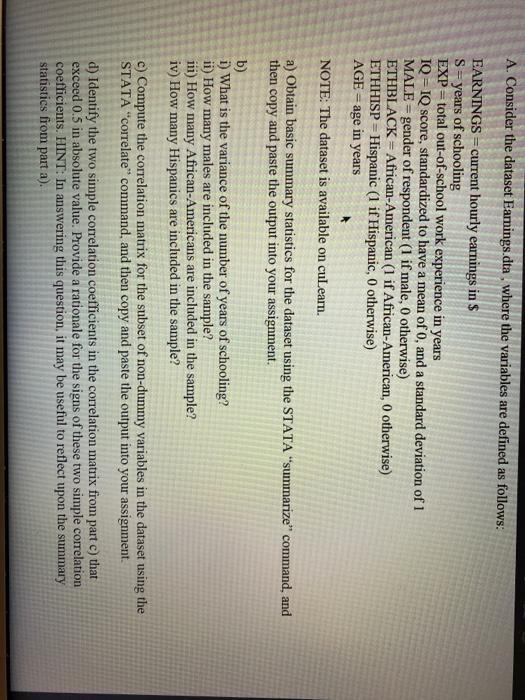
Question: A. Consider the dataset Earnings.dta , where the variables are defined as follows: EARNINGS = current hourly earnings in $ S = years of schooling

A. Consider the dataset Earnings.dta , where the
A. Consider the dataset Earnings.dta , where the variables are defined as follows: EARNINGS = current hourly earnings in $ S = years of schooling EXP = total out-of-school work experience in years IQ - IQ score, standardized to have a mean of o, and a standard deviation of 1 MALE = gender of respondent (1 if male, otherwise) ETHBLACK = African-American (1 if African-American, otherwise) ETHHISP Hispanic (1 if Hispanic, o otherwise) AGE = age in years NOTE: The dataset is available on culearn. a) Obtain basic summary statistics for the dataset using the STATA "summarize" command, and then copy and paste the output into your assignment. b) i) What is the variance of the number of years of schooling? ii) How many males are included in the sample? iii) How many African-Americans are included in the sample? iv) How many Hispanics are included in the sample? c) Compute the correlation matrix for the subset of non-dummy variables in the dataset using the STATA "correlate command, and then copy and paste the output into your assignment. d) Identify the two simple correlation coefficients in the correlation matrix from part c) that exceed 0.5 in absolute value. Provide a rationale for the signs of these two simple correlation coefficients. HINT: In answering this question, it may be useful to reflect upon the summary statistics from part a). A. Consider the dataset Earnings.dta , where the variables are defined as follows: EARNINGS = current hourly earnings in $ S = years of schooling EXP = total out-of-school work experience in years IQ - IQ score, standardized to have a mean of o, and a standard deviation of 1 MALE = gender of respondent (1 if male, otherwise) ETHBLACK = African-American (1 if African-American, otherwise) ETHHISP Hispanic (1 if Hispanic, o otherwise) AGE = age in years NOTE: The dataset is available on culearn. a) Obtain basic summary statistics for the dataset using the STATA "summarize" command, and then copy and paste the output into your assignment. b) i) What is the variance of the number of years of schooling? ii) How many males are included in the sample? iii) How many African-Americans are included in the sample? iv) How many Hispanics are included in the sample? c) Compute the correlation matrix for the subset of non-dummy variables in the dataset using the STATA "correlate command, and then copy and paste the output into your assignment. d) Identify the two simple correlation coefficients in the correlation matrix from part c) that exceed 0.5 in absolute value. Provide a rationale for the signs of these two simple correlation coefficients. HINT: In answering this question, it may be useful to reflect upon the summary statistics from part a)

Step by Step Solution

There are 3 Steps involved in it

1 Expert Approved Answer
Step: 1 Unlock blur-text-image
Question Has Been Solved by an Expert!

Get step-by-step solutions from verified subject matter experts

Step: 2 Unlock
Step: 3 Unlock

Students Have Also Explored These Related General Management Questions!